Published as a TradingView Idea on ZECUSDT. View the chart on TradingView
Buying last month’s winners is the commonest screen there is. We ranked 50 Bybit coins by their return each calendar month, from September 2025 to September 2026, and followed each month’s 10 best into the next month.
What we measured
Bybit daily closes for the 50 most traded perpetuals; a month’s return runs from the last close of one month to the last close of the next. That gives 12 pairs of months, so 120 places for a month’s 10 best to land the month after. With 50 coins, chance puts about 2 of the 10 back in the top 10, and about 2 in the bottom 10.
What we found
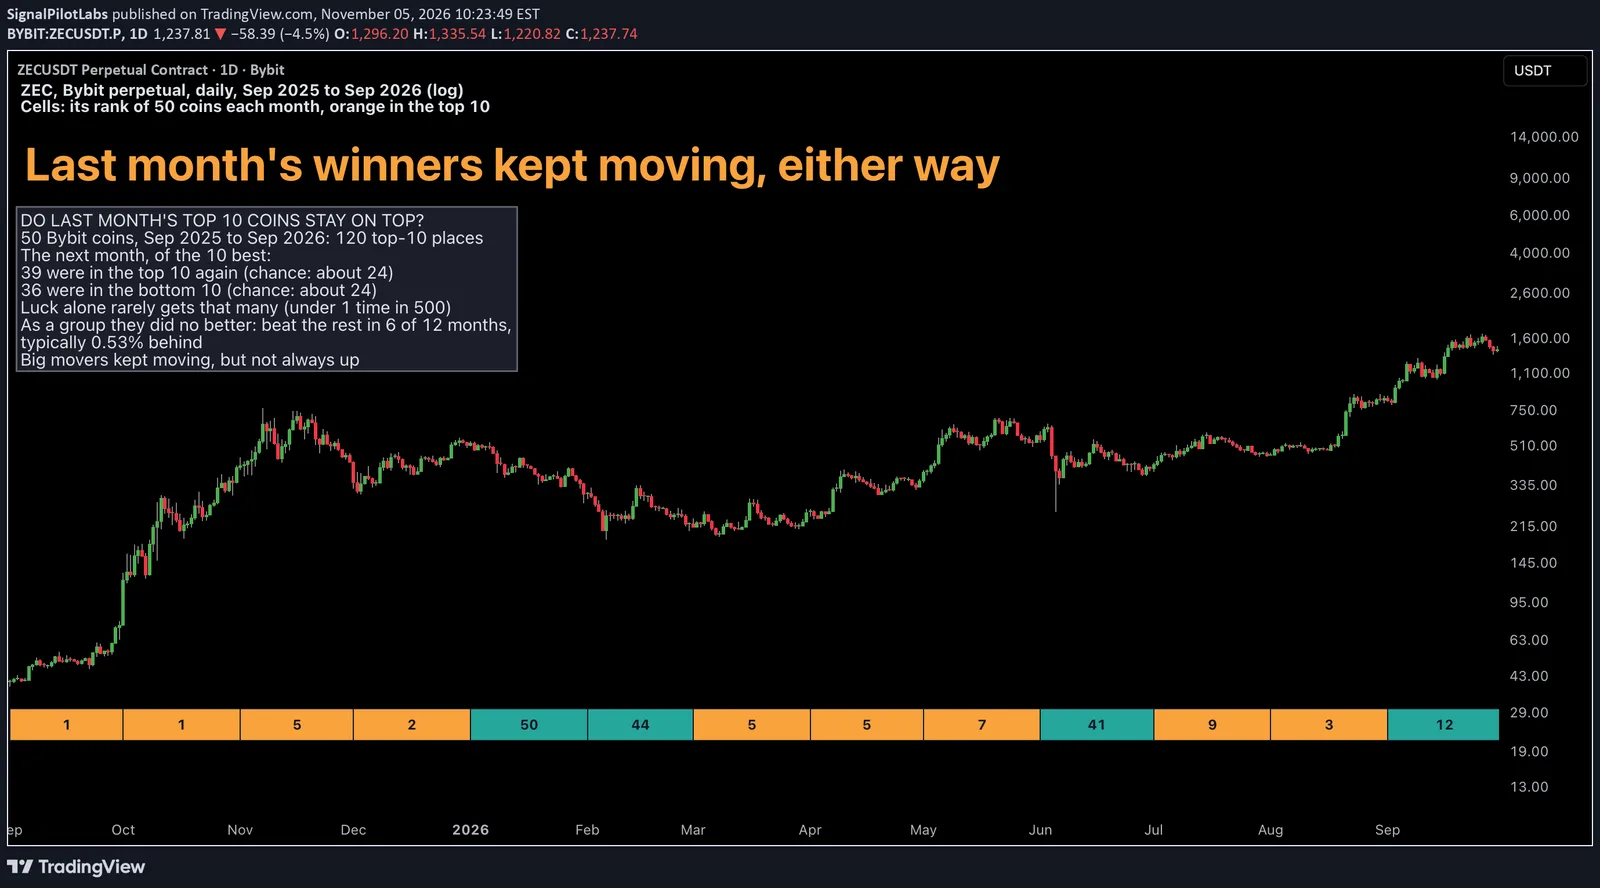
The leaders came back more often than chance: 39 of the 120 were in the next month’s 10 best, where chance gives about 24.
But nearly as many fell to the bottom: 36 of the 120 were in the next month’s 10 worst, again against about 24. This second count is a check we added after the run.
As a group, last month’s 10 best did no better the next month than the other coins: they beat them in 6 of the 12 months, and the median gap was -0.53%.
| Month of the 10 best | Back in the 10 best the next month | In the 10 worst the next month | The 10 best, next month (%) | The other coins, next month (%) |
|---|---|---|---|---|
| 2025-09 | 3 | 3 | -21.3 | -22.3 |
| 2025-10 | 3 | 4 | -24.0 | -22.9 |
| 2025-11 | 3 | 3 | -19.5 | -17.0 |
| 2025-12 | 3 | 1 | -12.7 | -13.8 |
| 2026-01 | 4 | 3 | -7.8 | -13.1 |
| 2026-02 | 4 | 3 | -2.8 | -2.8 |
| 2026-03 | 3 | 2 | +7.8 | +4.8 |
| 2026-04 | 4 | 4 | -3.0 | -1.4 |
| 2026-05 | 3 | 3 | -23.2 | -21.5 |
| 2026-06 | 2 | 5 | -10.0 | -0.9 |
| 2026-07 | 4 | 1 | +35.5 | +17.7 |
| 2026-08 | 3 | 4 | +34.0 | +40.4 |
Is it luck?
We shuffled each next month’s returns among the coins 10,000 times. Only 4 shuffles put 39 or more back in the top 10, and only 15 put 36 or more in the bottom 10. The return gap was ordinary: 77% of shuffles were as far from zero. The top 10 count held in both halves of the year, 20 of 60 and 19 of 60.
What to do with it
Last month’s winners tended to stay big movers, in either direction. A screen for last month’s top 10 picks volatility, not a side: size for both ways. Our post on a normal week in 50 coins measured how far a normal week moves: 8% for Bitcoin, like Tesla.
On the chart
ZEC, daily, on a log scale, with its rank each month in the cells: in the 10 best in 9 of 13 months, but 50th of 50 in January 2026.
How to check last month’s winners yourself
- Rank your coins by their return over each calendar month.
- Count how many of a month’s 10 best are in the next month’s 10 best, and how many in its 10 worst.
- Compare both counts with chance: 10 places out of the number of coins.
What this does not tell you
Which way next month’s movers will go. One year, one exchange. Past data.
Observations, not recommendations.
We’re Signal Pilot Labs. We build the Elite Seven, seven indicators for TradingView, and we post what we measure, including the parts that didn’t work.
See what we build at signalpilot.io.
Published as a TradingView Idea on ZECUSDT. View the chart on TradingView
Past measurement described after the fact. Nothing here is a recommendation or an indication of future results.