Published as a TradingView Idea on USOIL. View the chart on TradingView
How far does oil move in an ordinary week? We measured WTI oil, natural gas and copper over the last 52 weeks, from each week’s high to its low, the same way we measured gold, the big US tech stocks and 50 crypto coins.
What we measured
TradingView 4 hour candles for WTI oil (TVC:USOIL), natural gas (NYMEX:NG1!) and copper (COMEX:HG1!). A week’s range is its high minus its low, as a percent of where it opened. The last year is the 52 weeks starting 13 October 2025 to 5 October 2026, and the year before is printed beside it, never mixed in. The median is the normal week: half the weeks moved more, half less. The rules were written down before the run.
These are continuous futures charts. When one contract expires, the chart switches to the next, and the switch can leave a gap that no trade made. We took those gaps out: any jump from one 4 hour candle to the next that was bigger than 99% of that market’s jumps, and at least 0.3%, was scaled out of everything before it. That rule also takes out large jumps at the daily break, so the numbers lean slightly low. Left in, oil’s figure is 9.0% and natural gas’s 9.2%.
A normal week
WTI oil’s normal week was 9.2%, natural gas’s 9.1% and copper’s 5.2%. From the same measurement on other markets, Bitcoin’s was 8.1%, gold’s 5.1% and the S&P 500’s 2.2%.
So in the last year, oil and natural gas both moved further in a normal week than Bitcoin did. Oil moved more than 10% in 23 weeks of the 52 and natural gas in 19. Copper did it twice.
| Market | Median weekly range, switches taken out (%) | As TradingView shows it (%) | Weeks over 5% (of 52) | Weeks over 10% (of 52) | The year before: median range (%) | Gaps taken out, last year |
|---|---|---|---|---|---|---|
| WTI oil | 9.2 | 9.0 | 44 | 23 | 5.5 | 31 |
| Natural gas | 9.1 | 9.2 | 49 | 19 | 11.8 | 15 |
| Copper | 5.2 | 5.3 | 28 | 2 | 4.9 | 6 |
The same measurement on metals is in our post on gold, silver and copper, on big tech in our post on big tech’s normal week and on crypto in our post on 50 coins’ normal week, so the four tables read side by side.
Normal changes
A year earlier, oil’s normal week was 5.5%. This year it was 9.2%. Natural gas went the other way, from 11.8% to 9.1%. Copper barely moved, 4.9% to 5.2%.
The biggest weeks
Oil’s biggest week was the week of 9 March 2026, during the Iran war. TradingView’s oil chart touched 119.48 early on Monday and 76.73 on Tuesday. News reports tied the drop to talk of the US taking control of the Strait of Hormuz.
Natural gas’s was the week of 19 January, when an Arctic blast hit the US: from 3.38 to 5.65, and it closed the week 53% higher.
Reading a continuous futures chart
On 27 January at 23:00 UTC, TradingView’s natural gas chart (NG1!) drops 42% in one candle, from 6.49 to 3.79. That wasn’t a crash. The February contract, squeezed by the cold, was about to expire near $7.45, and the chart switched to March, which traded near $3.79. Oil’s chart does the same thing more quietly every month: on 17 September it gapped 4.6% at the switch. If you measure moves on one of these charts, look for the switches first.
The chart: WTI oil, the week of 21 September 2026
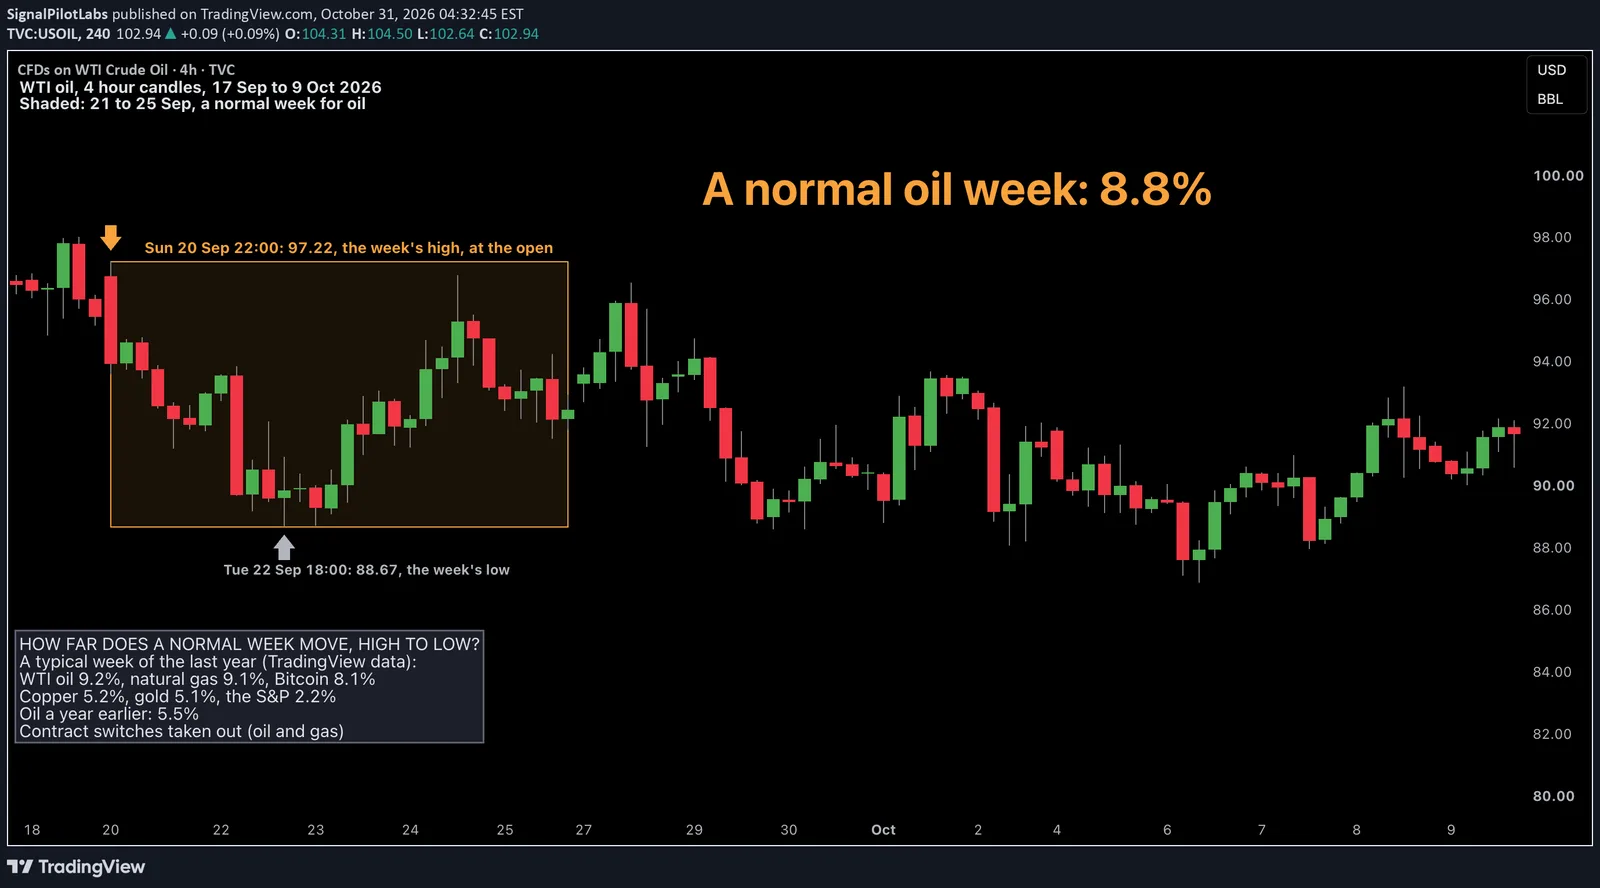
A normal week for oil this year, picked by a rule we set before looking: the most recent week within 10% of oil’s median with no contract switch inside it. Oil opened the week at 96.75 and made its high, 97.22, in the first candle. It reached 88.67 on Tuesday and closed the week at 92.45: an 8.8% range, down 4.4%.
How to check it on your own chart
- Open the market on a 4 hour chart and take one week, from its first candle to its last.
- Take the week’s high minus its low and divide by the week’s open.
- Look for a contract switch inside the week first. A gap at the switch isn’t a move.
- Compare it with the table: about 9% is a normal week for oil and natural gas, and about 5% for copper.
What this does not tell you
What next week will do, or which way. It’s one year of data, and a median says what usually happens, not what the unusual weeks do. The adjusted numbers lean slightly low and the unadjusted ones slightly high.
What it’s good for is knowing the size of an ordinary week before you size a position or set a stop.
Observations, not recommendations.
We’re Signal Pilot Labs. We build the Elite Seven, seven indicators for TradingView, and we post what we measure, including the parts that didn’t work.
See what we build at signalpilot.io.
Published as a TradingView Idea on USOIL. View the chart on TradingView
Past measurement described after the fact. Nothing here is a recommendation or an indication of future results.