Published as a TradingView Idea on BTCUSDT. View the chart on TradingView
Does a green week in crypto lead to another one? We took 50 Bybit coins over the 54 weeks to 11 October 2026 and looked at what each week did after a green week and after a red one.
What we measured
Bybit daily closes for the 50 most traded perpetuals. A week runs Monday to Sunday; it is green when it closes above the close of the week before. 2,648 pairs of one week and the next.
What we found
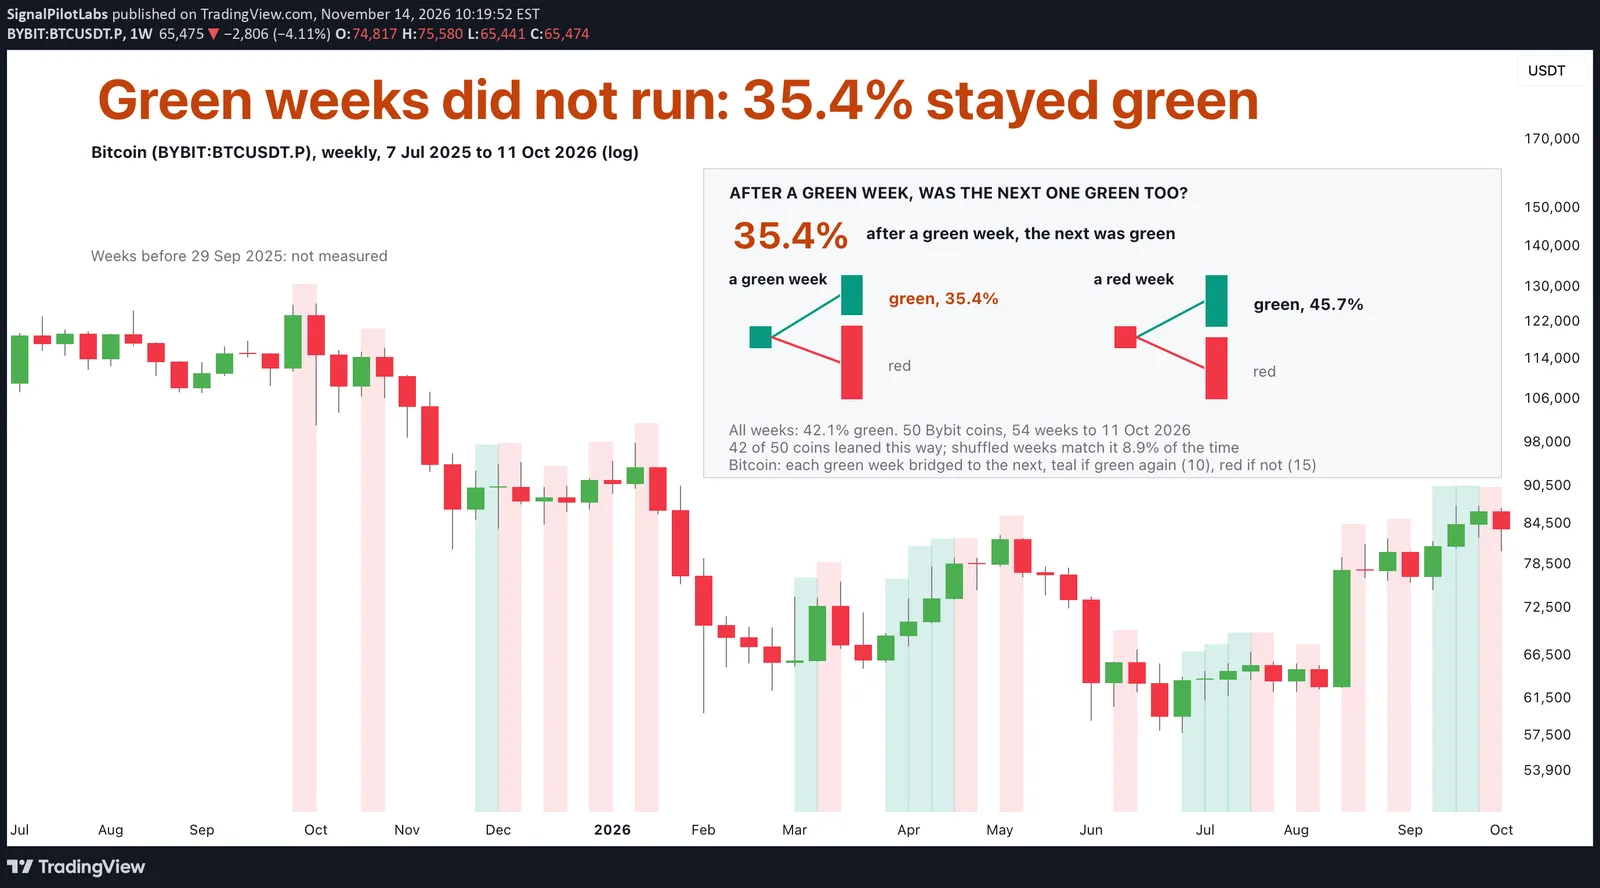
Green weeks did not run. After a green week, the next week was green 35.4% of the time. After a red week, 45.7%. Across all weeks, 42.1% were green, in a year when most of these coins fell. 42 of the 50 coins were less often green after a green week.
| Coin | Green weeks, of 54 | Green after a green week | Green after a red week |
|---|---|---|---|
| XMR | 31 | 14/31 | 16/22 |
| VVV | 29 | 16/29 | 13/24 |
| BR | 28 | 14/27 | 14/26 |
| ZRO | 28 | 11/27 | 17/26 |
| BNB | 27 | 13/27 | 13/26 |
| RLC | 26 | 12/25 | 13/28 |
| ZEC | 26 | 12/26 | 13/27 |
| AERO | 25 | 11/24 | 13/29 |
| BTC | 25 | 10/25 | 14/28 |
| HYPE | 25 | 9/25 | 15/28 |
| INJ | 25 | 12/24 | 12/28 |
| PUMPFUN | 25 | 10/25 | 14/28 |
| TAO | 25 | 9/25 | 15/28 |
| BCH | 24 | 10/24 | 13/29 |
| ETH | 24 | 10/24 | 13/29 |
| FARTCOIN | 24 | 10/24 | 13/29 |
| PENGU | 24 | 9/24 | 14/29 |
| UNI | 24 | 11/24 | 12/29 |
| USELESS | 24 | 9/24 | 14/29 |
| AAVE | 23 | 9/23 | 13/30 |
| ADA | 23 | 6/23 | 16/30 |
| NEAR | 23 | 6/22 | 16/31 |
| TIA | 23 | 7/22 | 15/31 |
| 1000PEPE | 22 | 9/22 | 12/31 |
| AKE | 22 | 9/22 | 13/31 |
| APT | 22 | 8/21 | 13/32 |
| FIL | 22 | 7/21 | 14/32 |
| LINK | 22 | 7/22 | 14/31 |
| ONDO | 22 | 6/21 | 15/32 |
| OP | 22 | 4/21 | 17/32 |
| SOL | 22 | 6/22 | 15/31 |
| ARB | 21 | 6/21 | 14/32 |
| LSK | 21 | 9/21 | 12/32 |
| MOVR | 21 | 10/20 | 10/33 |
| SUI | 21 | 7/21 | 13/32 |
| AVAX | 20 | 3/20 | 16/33 |
| DASH | 20 | 5/20 | 14/33 |
| DOGE | 20 | 6/20 | 13/33 |
| DOT | 20 | 5/19 | 14/34 |
| HBAR | 20 | 6/20 | 13/33 |
| LTC | 20 | 4/20 | 15/33 |
| SAND | 20 | 4/20 | 15/33 |
| STRK | 20 | 5/19 | 14/34 |
| WLD | 20 | 7/20 | 13/33 |
| XLM | 20 | 4/20 | 15/33 |
| XPL | 20 | 4/20 | 16/33 |
| ENA | 19 | 4/19 | 15/34 |
| QNT | 19 | 3/19 | 15/34 |
| TRUMP | 19 | 5/19 | 13/33 |
| XRP | 18 | 4/18 | 13/35 |
Is it luck?
Coins move together, so most of a week’s colour belongs to the whole market, and 42 coins is not 42 separate tests. We shuffled the order of the weeks 10,000 times, the same order for every coin. A gap of 10 points came up 8.9% of the time. That is a lean, not proof.
Did it hold in both halves?
We split the pairs at the start of April 2026. We did this after the results above were known, so it is a check rather than a test. The lean showed in both halves: 28.6% against 36.3% in the first, then 39.9% against 57.6% in the second.
One change before we ran it
We planned 59 weeks from late August 2025, but one coin, AKE, only started trading at the end of September. We shortened the window to the 54 weeks every coin had, before computing anything.
What to do with it
Do not read a green week as the start of a run. On this year’s record, the week after a green one was more often red. Whether that holds over a longer record is the next question. Our post on green days in 50 coins counted the same thing day by day.
On the chart
Bitcoin weekly, from 7 July 2025 to 11 October 2026 on a log scale, where equal steps on the price axis are equal percentage moves. The weeks before 29 September 2025 were not measured. Each green week is bridged to the next by a shaded span: teal when Bitcoin’s next week closed green too (10 times), red when it did not (15). The panel shows how the 50 coins’ next weeks split after a green week and after a red one.
How to check your coin’s weeks
- Take each week’s last close and mark the week green or red against the close a week earlier.
- Count how often a green week came after a green week, and after a red week.
- Shuffle the weeks many times to see how often chance gives a gap as large.
What this does not tell you
What next week will do. One year of weeks, one exchange, a falling year. Past data.
Observations, not recommendations.
We’re Signal Pilot Labs. We build the Elite Seven, seven indicators for TradingView, and we post what we measure, including the parts that didn’t work.
See what we build at signalpilot.io.
Published as a TradingView Idea on BTCUSDT. View the chart on TradingView
Past measurement described after the fact. Nothing here is a recommendation or an indication of future results.