Published as a TradingView Idea on HYPEUSDT. View the chart on TradingView
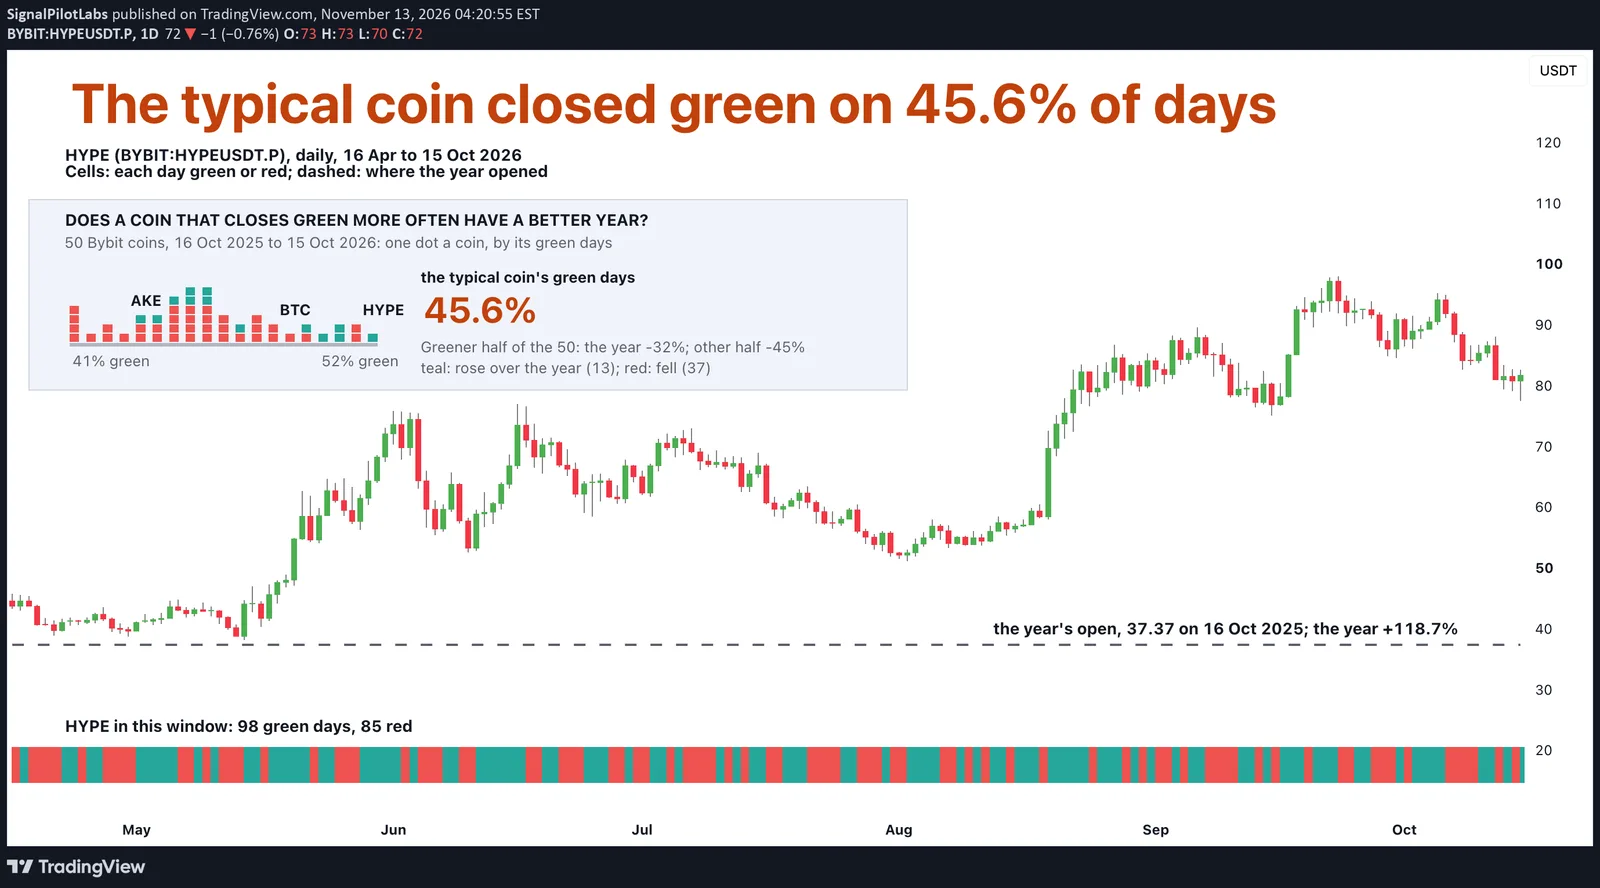
How often does a coin’s day close green? For the typical coin of 50, on 45.6% of days over the year to 15 October 2026. Only 5 of the 50 closed green on more than half their days.
What we measured
We took Bybit daily candles for 50 coins, the 365 days to 15 October 2026, in UTC. A green day closes above where it opened; a red day closes below it. For each coin we counted both and set the count beside its change over the year, from the first open to the last close. We declared the question on 17 October, before any coin was counted.
What we found
The median coin, the middle one of the 50, closed green on 45.6% of its days and fell 38.7% over the year. HYPE led with 188 green days of 365 (51.5%), then BNB and ETH (50.7%) and VVV and ZEC (50.4%). TRUMP had the fewest, 151 (41.4%).
Bitcoin closed green on 48.5% of its days and fell 25.8%. Solana was green on 47.7% and fell 45.6%. So the count barely moved from coin to coin, 41.4% to 51.5%, while the year ran from -81.6% for XPL to +1,623.7% for AKE.
All 50 coins
| Coin | Green days (of 365) | Green days (%) | Change over the year (%) |
|---|---|---|---|
| HYPE | 188 | 51.5 | +118.7 |
| BNB | 185 | 50.7 | -37.3 |
| ETH | 185 | 50.7 | -38.7 |
| VVV | 184 | 50.4 | +1450.8 |
| ZEC | 184 | 50.4 | +431.5 |
| XMR | 182 | 49.9 | +73.4 |
| PUMPFUN | 180 | 49.3 | +18.5 |
| FARTCOIN | 179 | 49.0 | -60.7 |
| BTC | 177 | 48.5 | -25.8 |
| FIL | 176 | 48.2 | -27.5 |
| LINK | 175 | 47.9 | -31.0 |
| LTC | 174 | 47.7 | -36.1 |
| SOL | 174 | 47.7 | -45.6 |
| USELESS | 174 | 47.7 | -52.3 |
| ARB | 172 | 47.1 | -40.1 |
| ZRO | 172 | 47.1 | +13.0 |
| AVAX | 169 | 46.3 | -54.1 |
| HBAR | 169 | 46.3 | -52.4 |
| XPL | 169 | 46.3 | -81.6 |
| BCH | 168 | 46.0 | -46.7 |
| 1000PEPE | 167 | 45.8 | -43.1 |
| AERO | 167 | 45.8 | +14.4 |
| DASH | 167 | 45.8 | +8.8 |
| LSK | 167 | 45.8 | -14.1 |
| TAO | 167 | 45.8 | -32.2 |
| AAVE | 166 | 45.5 | -35.0 |
| NEAR | 166 | 45.5 | +126.5 |
| RLC | 166 | 45.5 | -0.9 |
| PENGU | 165 | 45.2 | -67.2 |
| TIA | 165 | 45.2 | -44.8 |
| UNI | 165 | 45.2 | +13.1 |
| APT | 164 | 44.9 | -76.3 |
| STRK | 164 | 44.9 | -27.0 |
| MOVR | 163 | 44.7 | -65.9 |
| OP | 163 | 44.7 | -69.8 |
| QNT | 163 | 44.7 | +135.4 |
| BR | 162 | 44.4 | +509.1 |
| ONDO | 162 | 44.4 | -38.6 |
| SAND | 162 | 44.4 | -74.0 |
| DOGE | 160 | 43.8 | -58.6 |
| INJ | 160 | 43.8 | -5.6 |
| AKE | 159 | 43.6 | +1623.7 |
| SUI | 158 | 43.3 | -61.3 |
| ENA | 156 | 42.7 | -51.2 |
| XRP | 156 | 42.7 | -44.6 |
| WLD | 153 | 41.9 | -45.7 |
| ADA | 152 | 41.6 | -65.6 |
| DOT | 152 | 41.6 | -63.3 |
| XLM | 152 | 41.6 | -43.6 |
| TRUMP | 151 | 41.4 | -68.9 |
Does a greener coin have a better year?
A little, and that answer comes from a check we added afterwards. Ranked by green days and ranked by the year, the coins lined up loosely (0.36 on a scale where 1 is a perfect match). When we shuffled the years among the coins 10,000 times, a match that close turned up 65 times, so luck alone is unlikely. The greener half of the coins fell a median 32% over the year, while the other half fell 45%.
Size still beat the count. AKE closed green on only 43.6% of its days and rose 1,623.7%. ETH was green on 50.7% and fell 38.7%. Of the 45 coins green on fewer than half their days, 10 still rose.
Did it hold?
We split the year in two, also afterwards. In the falling first half, to 15 April, no coin was green on more than half its days, and the link was strong (0.54). In the rising second half, 16 coins were, and the link was faint (0.20): shuffles matched it 8% of the time, which luck could explain.
On the chart
HYPE, the coin with the most green days, daily from 16 April to 15 October 2026. Under the candles, the cells are its days, 98 green and 85 red. The dashed line marks where its year opened, 37.374 on 16 October 2025; it closed the year at 81.751, up 118.7%. The box shows all 50 coins as dots by their green days: teal if the coin rose over the year, red if it fell.
Count it yourself
- Open a daily chart of your coin and count the days whose close finished above the open.
- Divide by the number of days you counted; over this year, 45.6% was typical.
- Set the share beside the change over the same days, and look at how big the green days were, not only how many.
Where the same 50 coins sat in their 52-week range on 8 November 2026 is in our post on the 52-week range, 24 days after this year ended.
What this does not tell you
What any coin does next. A green day says where the close finished against the open, not how far the price moved. Past data.
Observations, not recommendations.
We’re Signal Pilot Labs. We build the Elite Seven, seven indicators for TradingView, and we post what we measure, including the parts that didn’t work.
See what we build at signalpilot.io.
Published as a TradingView Idea on HYPEUSDT. View the chart on TradingView
Past measurement described after the fact. Nothing here is a recommendation or an indication of future results.