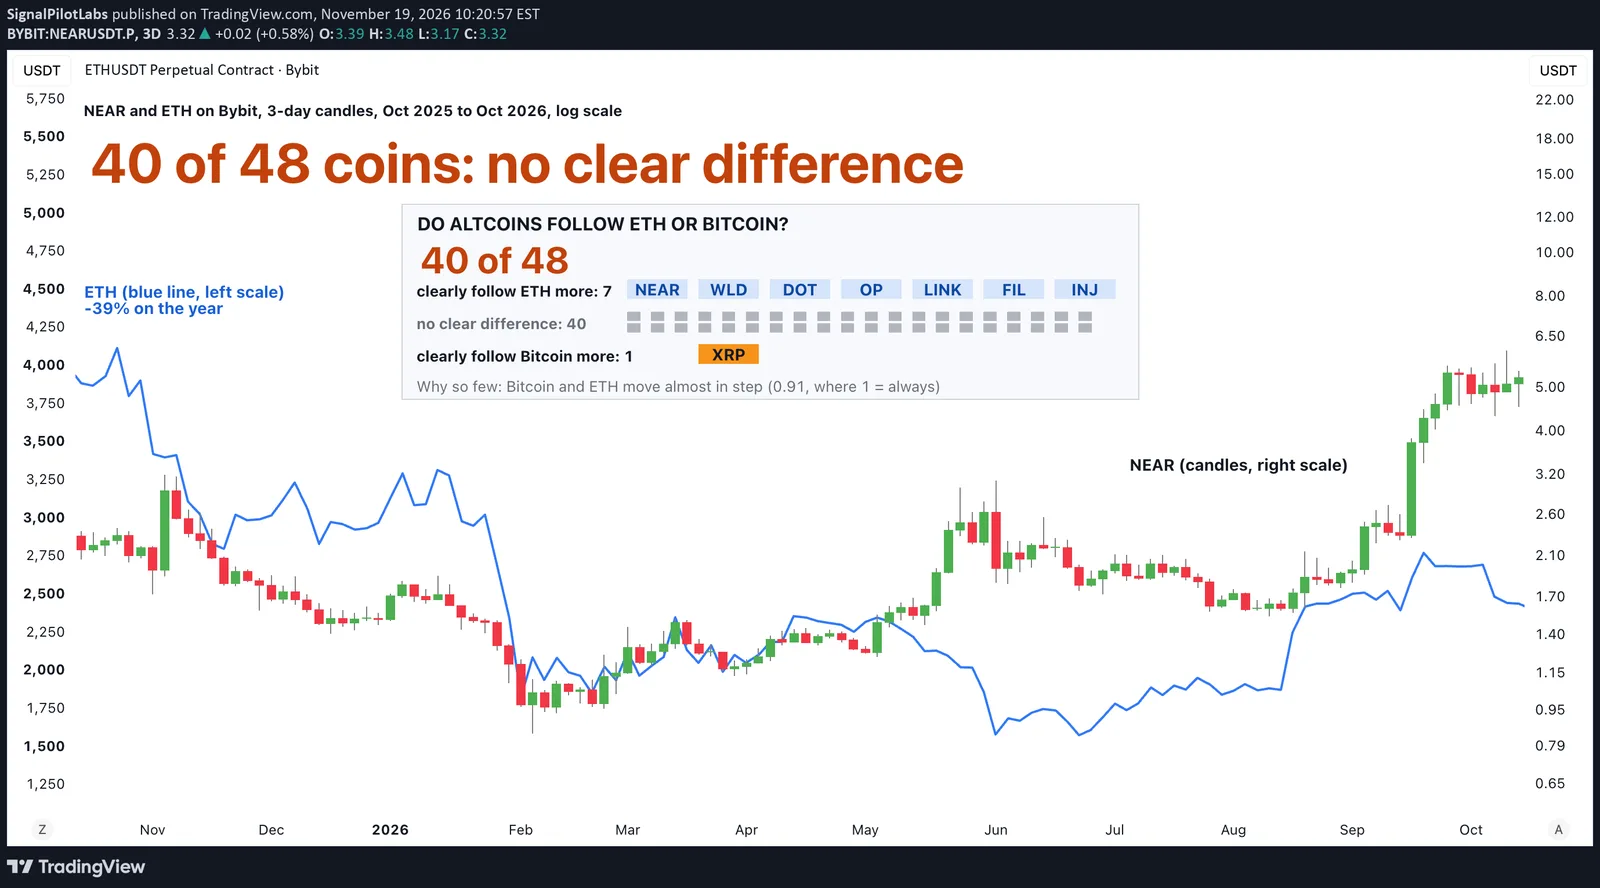
Published as a TradingView Idea on NEARUSDT. View the chart on TradingView
Many altcoin holders say their coin trades with ETH, not Bitcoin. We checked 48 coins over a full year.
What we measured
Bybit daily closes, the 365 days from 16 October 2025 to 15 October 2026, in UTC. Each day’s move is its close against the day before. For each coin we took two correlations of its daily moves: with Bitcoin’s and with ETH’s. The lean is the difference. Above zero, the coin moved more closely with ETH.
To call a lean clear, we resampled the 365 days 2,000 times and set the bar before running it: the lean had to stay on the same side in 97.5% of the resamples. Our post on how tied each coin is to Bitcoin had already measured the Bitcoin half, so we said so.
What we found
Bitcoin and ETH moved together at 0.905, so for most coins they tell the same story. 40 of the 48 coins had no clear lean, SOL among them: 0.87 with Bitcoin, 0.88 with ETH.
Seven tilted clearly toward ETH: NEAR, WLD, DOT, OP, LINK, FIL and INJ. NEAR leaned the most, 0.58 with ETH against 0.52 with Bitcoin. One tilted clearly toward Bitcoin: XRP, 0.86 with Bitcoin against 0.82 with ETH.
With 48 coins, a bar like ours lets about 1 coin through on each side by chance alone. The ETH side let through 7. The leans are small, though: the median coin sat 0.009 closer to ETH. HYPE had the third largest lean and still missed the bar, at 97.0%.
| Coin | Correlation with ETH | Correlation with Bitcoin | Lean toward ETH | Clear lean |
|---|---|---|---|---|
| NEAR | 0.58 | 0.52 | +0.064 | ETH |
| WLD | 0.54 | 0.48 | +0.064 | ETH |
| HYPE | 0.53 | 0.49 | +0.045 | no |
| DOT | 0.65 | 0.61 | +0.042 | ETH |
| OP | 0.64 | 0.60 | +0.041 | ETH |
| LINK | 0.86 | 0.82 | +0.041 | ETH |
| XPL | 0.55 | 0.51 | +0.038 | no |
| FARTCOIN | 0.66 | 0.62 | +0.036 | no |
| FIL | 0.47 | 0.44 | +0.035 | ETH |
| INJ | 0.62 | 0.59 | +0.033 | ETH |
| TRUMP | 0.49 | 0.45 | +0.033 | no |
| AVAX | 0.74 | 0.72 | +0.029 | no |
| ENA | 0.61 | 0.58 | +0.028 | no |
| TIA | 0.62 | 0.59 | +0.027 | no |
| ARB | 0.62 | 0.60 | +0.027 | no |
| ONDO | 0.62 | 0.60 | +0.024 | no |
| APT | 0.70 | 0.67 | +0.022 | no |
| USELESS | 0.53 | 0.51 | +0.020 | no |
| PUMPFUN | 0.53 | 0.51 | +0.020 | no |
| ZRO | 0.46 | 0.44 | +0.018 | no |
| LTC | 0.72 | 0.71 | +0.016 | no |
| AAVE | 0.71 | 0.70 | +0.016 | no |
| XMR | 0.48 | 0.47 | +0.013 | no |
| SOL | 0.88 | 0.87 | +0.009 | no |
| SAND | 0.55 | 0.54 | +0.009 | no |
| ADA | 0.81 | 0.80 | +0.008 | no |
| ZEC | 0.49 | 0.49 | +0.008 | no |
| 1000PEPE | 0.71 | 0.70 | +0.006 | no |
| AERO | 0.65 | 0.65 | +0.004 | no |
| AKE | 0.05 | 0.05 | +0.003 | no |
| PENGU | 0.72 | 0.72 | +0.001 | no |
| SUI | 0.76 | 0.76 | +0.001 | no |
| UNI | 0.59 | 0.59 | +0.000 | no |
| DOGE | 0.79 | 0.80 | -0.001 | no |
| RLC | 0.34 | 0.34 | -0.002 | no |
| STRK | 0.43 | 0.43 | -0.002 | no |
| LSK | 0.14 | 0.15 | -0.003 | no |
| BR | 0.10 | 0.10 | -0.006 | no |
| XLM | 0.59 | 0.60 | -0.007 | no |
| TAO | 0.61 | 0.62 | -0.011 | no |
| VVV | 0.38 | 0.39 | -0.016 | no |
| DASH | 0.39 | 0.41 | -0.016 | no |
| QNT | 0.24 | 0.26 | -0.016 | no |
| BNB | 0.79 | 0.81 | -0.017 | no |
| HBAR | 0.64 | 0.65 | -0.017 | no |
| MOVR | 0.26 | 0.29 | -0.026 | no |
| BCH | 0.58 | 0.62 | -0.037 | no |
| XRP | 0.82 | 0.86 | -0.041 | Bitcoin |
Does it hold?
We split the year into halves. Six of the 7 ETH coins leaned toward ETH in both, DOT did not, and XRP leaned toward Bitcoin in both. Across all 48 coins, only 25 kept the same lean in both halves, about what a coin toss gives. The clear leans held. The faint ones did not.
What to do with it
If you hold one of the 7, ETH’s daily move matched your coin’s a little more closely than Bitcoin’s did this year. For the other 40, watching Bitcoin or ETH told the same story.
On the chart
NEAR, 3-day candles, October 2025 to October 2026, on a log scale: the coin that leaned furthest toward ETH, picked by a rule we set before measuring. The blue line is ETH, drawn over it on its own scale (the left axis). NEAR rose 127% over the year while ETH fell 39%. The tie is in the day-to-day moves, not the trend.
How to check your own coin
- Take a year of daily closes for your coin, for Bitcoin and for ETH, the same days.
- Work out each day’s move for all three: the close against the close the day before.
- Put the moves into a spreadsheet’s correlation function (CORREL in Excel and Google Sheets), once against Bitcoin and once against ETH.
- Subtract the Bitcoin figure from the ETH figure. Above zero, your coin moved more closely with ETH.
- Do it again on each half of the year. A lean that flips is not a lean.
What this does not tell you
Whether a coin’s lean lasts, or how far the coin goes when ETH does. A correlation says the days line up, not that the coin goes as far as ETH. Past data.
Observations, not recommendations.
We’re Signal Pilot Labs. We build the Elite Seven, seven indicators for TradingView, and we post what we measure, including the parts that didn’t work.
See what we build at signalpilot.io.
Published as a TradingView Idea on NEARUSDT. View the chart on TradingView
Past measurement described after the fact. Nothing here is a recommendation or an indication of future results.