Published as a TradingView Idea on AKEUSDT. View the chart on TradingView
How closely does a coin follow Bitcoin? We measured it for 49 coins over a full year, two ways, and set the year beside its two halves and its last 90 days.
What we measured
Bybit daily closes for Bitcoin and 49 other coins, the 365 days from 16 October 2025 to 15 October 2026, in UTC. Each day’s change is its close against the day before.
For each coin we took two numbers. One is its correlation (1 means always in step, 0 no link). The other is the share of days it closed the same way as Bitcoin, both up or both down, where a coin flip would land near 50%.
What we found
The typical coin, the middle one of the 49, scored 0.59 and closed the same way as Bitcoin on 75.3% of days. That is about 3 days in 4.
The most tied was ETH at 0.91, the same way on 86.8% of days. SOL followed at 0.87 and XRP at 0.86, then LINK and BNB. In all, eleven of the 49 coins scored 0.70 or more.
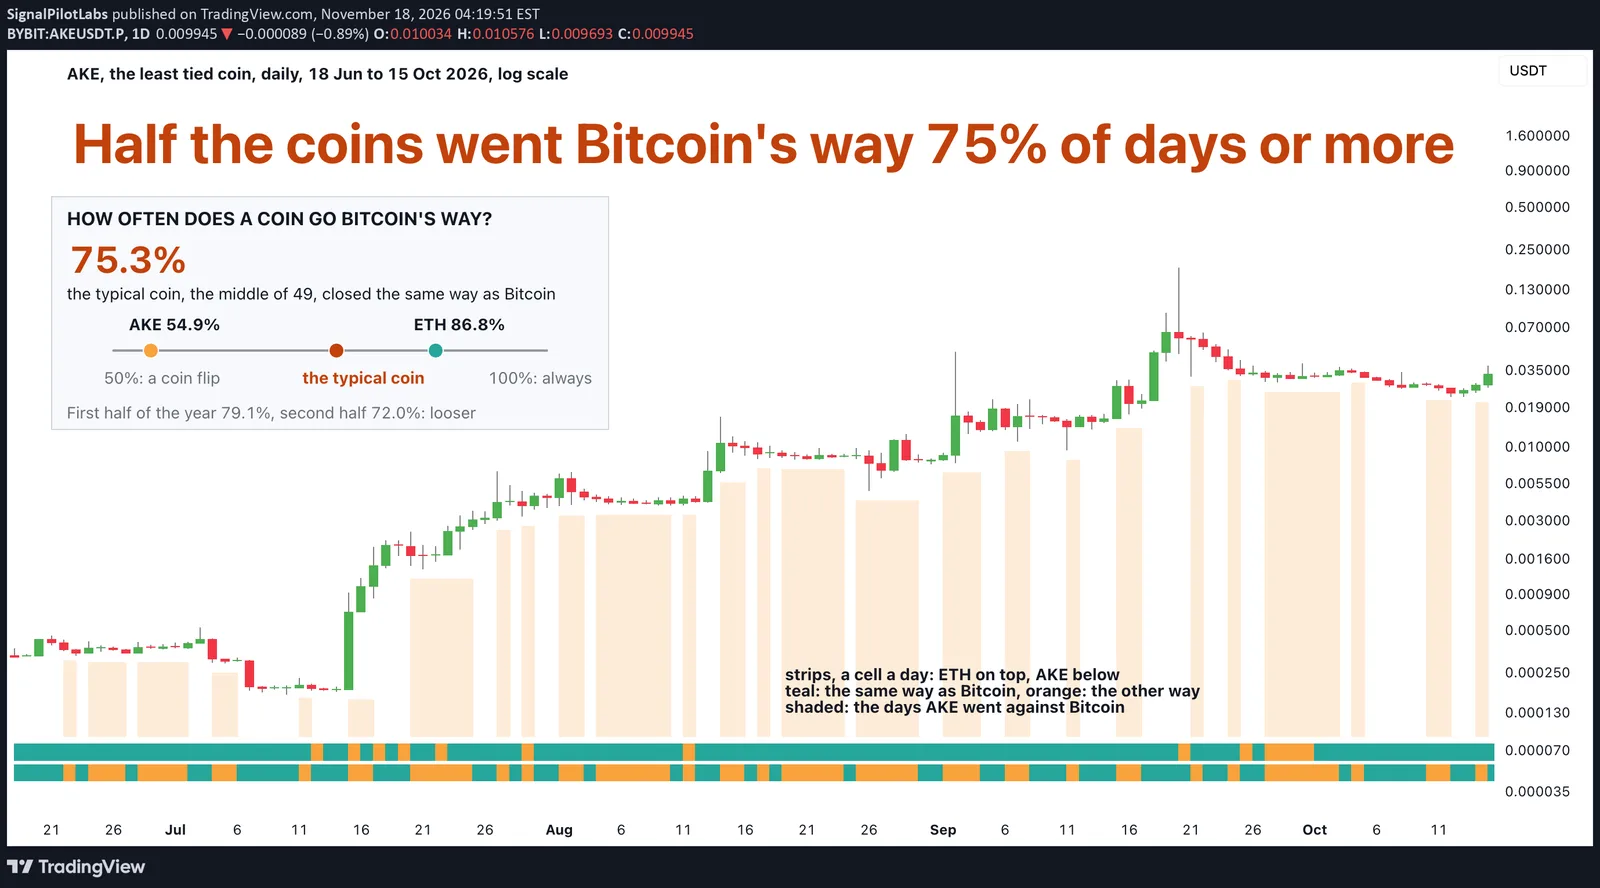
The least tied was AKE at 0.05, the same way on 54.9% of days. That is close to a coin flip. BR scored 0.10, and sixteen coins were under 0.50, HYPE among them at 0.49.
| Coin | Correlation with Bitcoin, the year | Days closed the same way as Bitcoin (%) | Correlation, the last 90 days |
|---|---|---|---|
| ETH | 0.91 | 86.8 | 0.88 |
| SOL | 0.87 | 86.6 | 0.83 |
| XRP | 0.86 | 84.1 | 0.89 |
| LINK | 0.82 | 83.6 | 0.68 |
| BNB | 0.81 | 86.3 | 0.71 |
| ADA | 0.80 | 82.2 | 0.78 |
| DOGE | 0.80 | 81.6 | 0.83 |
| SUI | 0.76 | 82.1 | 0.69 |
| PENGU | 0.72 | 81.4 | 0.70 |
| AVAX | 0.72 | 81.9 | 0.49 |
| LTC | 0.71 | 78.4 | 0.61 |
| 1000PEPE | 0.70 | 81.0 | 0.80 |
| AAVE | 0.70 | 78.9 | 0.67 |
| APT | 0.67 | 77.8 | 0.60 |
| HBAR | 0.65 | 76.4 | 0.42 |
| AERO | 0.65 | 77.5 | 0.42 |
| FARTCOIN | 0.62 | 77.2 | 0.70 |
| TAO | 0.62 | 77.0 | 0.71 |
| BCH | 0.62 | 75.3 | 0.60 |
| DOT | 0.61 | 74.5 | 0.47 |
| XLM | 0.60 | 78.2 | 0.75 |
| OP | 0.60 | 74.8 | 0.58 |
| ONDO | 0.60 | 80.8 | 0.53 |
| ARB | 0.60 | 76.2 | 0.46 |
| UNI | 0.59 | 79.1 | 0.52 |
| TIA | 0.59 | 73.9 | 0.48 |
| INJ | 0.59 | 75.1 | 0.50 |
| ENA | 0.58 | 76.7 | 0.55 |
| SAND | 0.54 | 77.8 | 0.27 |
| NEAR | 0.52 | 71.2 | 0.41 |
| XPL | 0.51 | 68.4 | 0.59 |
| USELESS | 0.51 | 72.3 | 0.44 |
| PUMPFUN | 0.51 | 71.2 | 0.27 |
| HYPE | 0.49 | 69.6 | 0.64 |
| ZEC | 0.49 | 69.0 | 0.54 |
| WLD | 0.48 | 73.2 | 0.49 |
| XMR | 0.47 | 65.2 | 0.34 |
| TRUMP | 0.45 | 74.5 | 0.46 |
| ZRO | 0.44 | 64.1 | 0.28 |
| FIL | 0.44 | 73.9 | 0.46 |
| STRK | 0.43 | 73.0 | 0.41 |
| DASH | 0.41 | 73.4 | 0.38 |
| VVV | 0.39 | 66.3 | 0.32 |
| RLC | 0.34 | 69.2 | 0.11 |
| MOVR | 0.29 | 72.5 | 0.20 |
| QNT | 0.26 | 67.0 | 0.11 |
| LSK | 0.15 | 71.0 | 0.00 |
| BR | 0.10 | 53.4 | 0.16 |
| AKE | 0.05 | 54.9 | -0.03 |
Two halves and the last 90 days
After the result was known, we also split the year into two halves. The typical coin scored 0.68 in the first half, to mid April, but only 0.47 in the second. Just 8 of the 49 coins were tied more closely in the second half, and ETH was the most tied in both.
The last 90 days, 18 July to 15 October, tell the same story. The typical score fell to 0.50 and the same-way share to 71.1%. In those days 36 of the 49 coins went their own way more often. Among them, SAND fell from 0.54 to 0.27, and AVAX from 0.72 to 0.49. A few tightened, HYPE from 0.49 to 0.64 and XLM from 0.60 to 0.75.
A loose tie is not the same as a calm coin. Our post on a book that looked diversified shows how a tie read in quiet weeks can fail in a fast one.
On the chart
AKE, the least tied coin, picked by a rule we set before measuring, daily over the last 120 days of the year, on a log scale, where each step up the price axis is the same percentage move. The two strips along the bottom show each day, ETH on top and AKE below: teal where the coin closed the same way as Bitcoin, orange where it went the other way.
The shaded columns mark the days AKE went against Bitcoin. ETH’s strip is mostly teal, and AKE’s is close to half and half. We first drew the whole year, but its candles came out too thin to read, so the chart shows the last 120 days, a change made for the picture only.
How to check your own coin
- Take a year of daily closes for your coin and for Bitcoin, the same days.
- Turn each into a daily move: the close against the day before.
- Count the days both moved the same way, and divide by the days both moved.
- For the correlation, put the two columns of moves into a spreadsheet’s correlation function (CORREL in Excel and Google Sheets).
- Do it again on the last 90 days. A tie changes.
What this does not tell you
How far a coin goes when Bitcoin moves. A high score says the days line up, not that the sizes match. It doesn’t tell you to buy or sell, and a coin’s tie to Bitcoin changes, as the halves show. Past data.
Observations, not recommendations.
We’re Signal Pilot Labs. We build the Elite Seven, seven indicators for TradingView, and we post what we measure, including the parts that didn’t work.
See what we build at signalpilot.io.
Published as a TradingView Idea on AKEUSDT. View the chart on TradingView
Past measurement described after the fact. Nothing here is a recommendation or an indication of future results.