Published as a TradingView Idea on ETHUSDT. View the chart on TradingView
Crypto trades around the clock, but it doesn’t move the same every hour. We measured which hour of the day each of the 50 most traded coins moves most, so you know when yours tends to wake up.
What we measured
The 50 most traded crypto perpetuals on Bybit, ranked by turnover from 11 September to 10 October 2026, each listed for the whole year. One hour bars, 14 October 2025 to 14 October 2026, 8,760 hours per coin. An hour’s move is how far it closed from the hour before, up or down. For each coin, the median move in each hour of the day, in UTC. For the market as a whole, each coin’s hours are divided by its own median hour, so a quiet coin and a wild one weigh the same, and then we take the median coin. The rules were written down before the run.
The busiest hour
46 of the 50 coins move most at 14:00 or 15:00 UTC. For the median coin those hours move about 1.4 times an ordinary hour. The quietest is 23:00 UTC, with 10:00 and 11:00 UTC close behind.
It follows New York’s clock
In US summer time the busiest hour was 14:00 UTC. In US winter time, 2 November 2025 to 8 March 2026, it was 15:00 UTC, at 1.8 times an ordinary hour. BTC, ETH and SOL each moved the same way.
Both are the same hour in New York: 10:00 to 11:00, the first full hour after the stock market opens, and the minute many US releases come out. US clocks change on 1 November. If the busy hour follows the clock as it did last winter, it moves to 15:00 UTC from then until March.
Each hour of the day for the median coin, as a multiple of an ordinary hour:
| Hour (UTC) | Whole year | US winter time | US summer time |
|---|---|---|---|
| 00:00 | 0.99 | 1.06 | 0.95 |
| 01:00 | 1.03 | 1.02 | 1.02 |
| 02:00 | 0.98 | 1.03 | 0.96 |
| 03:00 | 0.96 | 1.04 | 0.91 |
| 04:00 | 0.93 | 0.96 | 0.93 |
| 05:00 | 0.92 | 0.87 | 0.93 |
| 06:00 | 0.90 | 0.98 | 0.86 |
| 07:00 | 0.91 | 0.97 | 0.86 |
| 08:00 | 0.95 | 1.12 | 0.88 |
| 09:00 | 0.94 | 1.02 | 0.89 |
| 10:00 | 0.88 | 0.85 | 0.89 |
| 11:00 | 0.90 | 0.93 | 0.87 |
| 12:00 | 1.00 | 0.99 | 1.01 |
| 13:00 | 1.15 | 1.25 | 1.12 |
| 14:00 | 1.37 | 1.63 | 1.25 |
| 15:00 | 1.37 | 1.83 | 1.19 |
| 16:00 | 1.18 | 1.62 | 1.05 |
| 17:00 | 1.12 | 1.30 | 1.06 |
| 18:00 | 1.04 | 1.41 | 0.94 |
| 19:00 | 0.95 | 1.13 | 0.88 |
| 20:00 | 0.95 | 1.12 | 0.88 |
| 21:00 | 0.98 | 1.03 | 0.93 |
| 22:00 | 1.02 | 1.12 | 0.99 |
| 23:00 | 0.87 | 0.98 | 0.83 |
How much each US release moves crypto in its own hour is in our ranking of 303 US releases, where the jobs data moves crypto more than inflation does.
Coin by coin
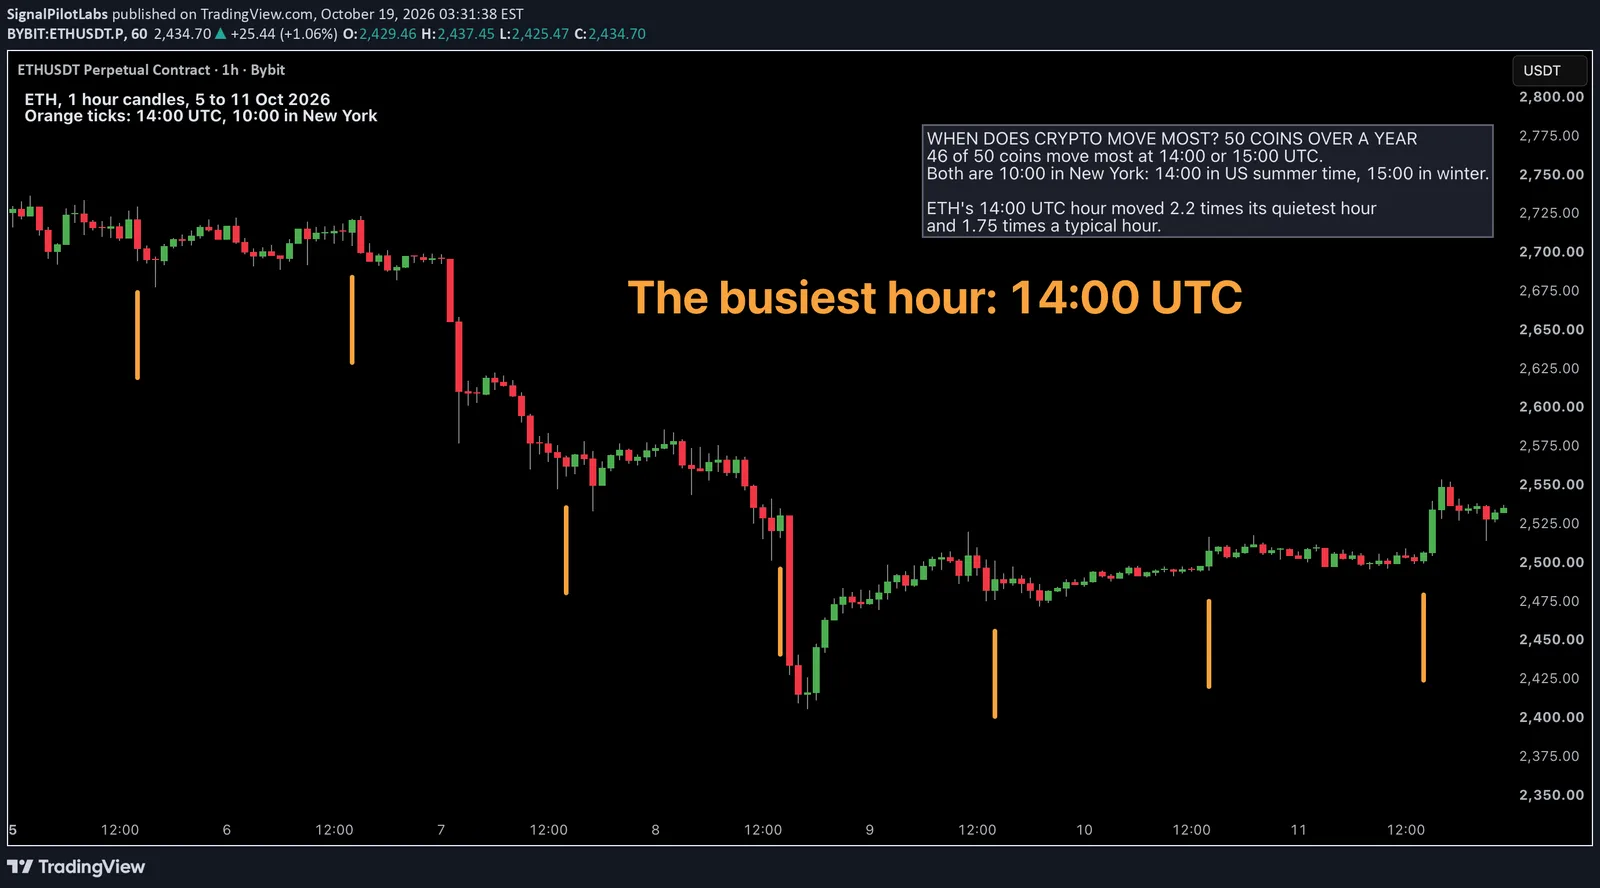
ETH’s busiest hour moved 2.2 times its quietest, the widest gap of the 50. BTC’s moved 1.9 times, SOL’s 1.8. LSK is the odd one out: its busiest hour is midnight UTC. Three coins, PUMPFUN, AKE and BR, peak an hour later, at 16:00 UTC.
| Coin | Busiest hour (UTC) | Its median move (%) | Quietest hour (UTC) | Busiest / quietest | Busiest / median hour |
|---|---|---|---|---|---|
| BTC | 14:00 | 0.32 | 05:00 | 1.92 | 1.63 |
| ETH | 14:00 | 0.44 | 10:00 | 2.22 | 1.75 |
| SOL | 14:00 | 0.45 | 10:00 | 1.81 | 1.47 |
| XRP | 14:00 | 0.44 | 23:00 | 1.90 | 1.53 |
| ZEC | 14:00 | 0.83 | 09:00 | 1.59 | 1.29 |
| NEAR | 15:00 | 0.71 | 11:00 | 1.61 | 1.41 |
| HYPE | 14:00 | 0.67 | 06:00 | 1.68 | 1.33 |
| DOGE | 14:00 | 0.48 | 10:00 | 1.99 | 1.54 |
| ENA | 14:00 | 0.81 | 23:00 | 1.85 | 1.46 |
| SUI | 14:00 | 0.58 | 10:00 | 1.70 | 1.43 |
| ONDO | 15:00 | 0.69 | 23:00 | 1.86 | 1.45 |
| PUMPFUN | 16:00 | 0.91 | 10:00 | 1.81 | 1.35 |
| ADA | 15:00 | 0.61 | 10:00 | 2.02 | 1.56 |
| 1000PEPE | 15:00 | 0.68 | 10:00 | 2.05 | 1.58 |
| QNT | 15:00 | 0.55 | 07:00 | 1.72 | 1.43 |
| WLD | 15:00 | 0.83 | 02:00 | 1.80 | 1.53 |
| UNI | 15:00 | 0.67 | 09:00 | 1.74 | 1.45 |
| LSK | 00:00 | 0.54 | 23:00 | 1.63 | 1.32 |
| AKE | 16:00 | 1.03 | 21:00 | 1.34 | 1.18 |
| ARB | 15:00 | 0.67 | 23:00 | 1.76 | 1.42 |
| AVAX | 14:00 | 0.50 | 04:00 | 1.74 | 1.45 |
| LINK | 14:00 | 0.52 | 06:00 | 1.82 | 1.50 |
| TAO | 14:00 | 0.73 | 11:00 | 1.72 | 1.39 |
| AAVE | 15:00 | 0.66 | 11:00 | 1.84 | 1.50 |
| LTC | 14:00 | 0.47 | 07:00 | 1.90 | 1.61 |
| HBAR | 15:00 | 0.55 | 05:00 | 1.97 | 1.55 |
| BNB | 15:00 | 0.30 | 10:00 | 1.68 | 1.36 |
| XPL | 14:00 | 0.92 | 10:00 | 1.66 | 1.32 |
| SAND | 15:00 | 0.60 | 06:00 | 1.72 | 1.40 |
| TRUMP | 15:00 | 0.55 | 11:00 | 1.78 | 1.44 |
| STRK | 14:00 | 0.70 | 11:00 | 1.63 | 1.37 |
| BCH | 14:00 | 0.42 | 07:00 | 1.59 | 1.31 |
| XLM | 15:00 | 0.56 | 23:00 | 1.87 | 1.47 |
| ZRO | 15:00 | 0.76 | 11:00 | 1.57 | 1.31 |
| USELESS | 14:00 | 1.29 | 23:00 | 1.53 | 1.30 |
| FARTCOIN | 15:00 | 0.88 | 11:00 | 1.73 | 1.32 |
| PENGU | 14:00 | 0.83 | 23:00 | 1.97 | 1.50 |
| XMR | 15:00 | 0.54 | 03:00 | 1.53 | 1.17 |
| APT | 15:00 | 0.65 | 10:00 | 1.73 | 1.35 |
| INJ | 14:00 | 0.70 | 05:00 | 1.56 | 1.36 |
| VVV | 15:00 | 1.05 | 07:00 | 1.87 | 1.41 |
| BR | 16:00 | 0.83 | 23:00 | 1.50 | 1.17 |
| DOT | 14:00 | 0.56 | 10:00 | 1.78 | 1.38 |
| OP | 14:00 | 0.66 | 11:00 | 1.58 | 1.33 |
| MOVR | 15:00 | 0.80 | 23:00 | 1.83 | 1.45 |
| RLC | 15:00 | 0.64 | 23:00 | 1.85 | 1.47 |
| FIL | 14:00 | 0.65 | 08:00 | 1.71 | 1.45 |
| TIA | 15:00 | 0.74 | 23:00 | 1.73 | 1.39 |
| DASH | 14:00 | 0.76 | 05:00 | 1.60 | 1.35 |
| AERO | 15:00 | 0.80 | 03:00 | 1.77 | 1.48 |
The chart
ETH, one hour, the week of 5 to 11 October 2026, with each day’s 14:00 UTC candle marked. On all seven days that hour moved more than the day’s median hour, but it was the day’s single biggest hour only once, on Saturday, and the week’s two largest drops came at other times: Thursday 15:00 and Wednesday 02:00 UTC. A median is not a promise about any one day.
ETH is on the chart by a rule we wrote before looking: the coin whose busiest hour stands out most against its own median hour, 1.75 times, on the most recent full week when we built this post.
How to check it on your own chart
- Open your coin on a 1 hour chart with the time zone set to UTC.
- Find its row in the table: its busiest and its quietest hour.
- Last winter, from November to March, the busy hour sat an hour later in UTC: 15:00 instead of 14:00.
- Read it as size, not direction. The busy hour moves more, either way.
What this does not tell you
Which way. It measures how much an hour moves, not its direction, and it isn’t a signal. One year, one exchange, medians. The busy hour also holds US data releases, so part of what it measures is them.
What it’s good for is knowing when your coin tends to wake up, and when it tends to sleep.
Observations, not recommendations.
We’re Signal Pilot Labs. We build the Elite Seven, seven indicators for TradingView, and we post what we measure, including the parts that didn’t work.
See what we build at signalpilot.io.
Published as a TradingView Idea on ETHUSDT. View the chart on TradingView
Past measurement described after the fact. Nothing here is a recommendation or an indication of future results.