Published as a TradingView Idea on BTCUSD. View the chart on TradingView
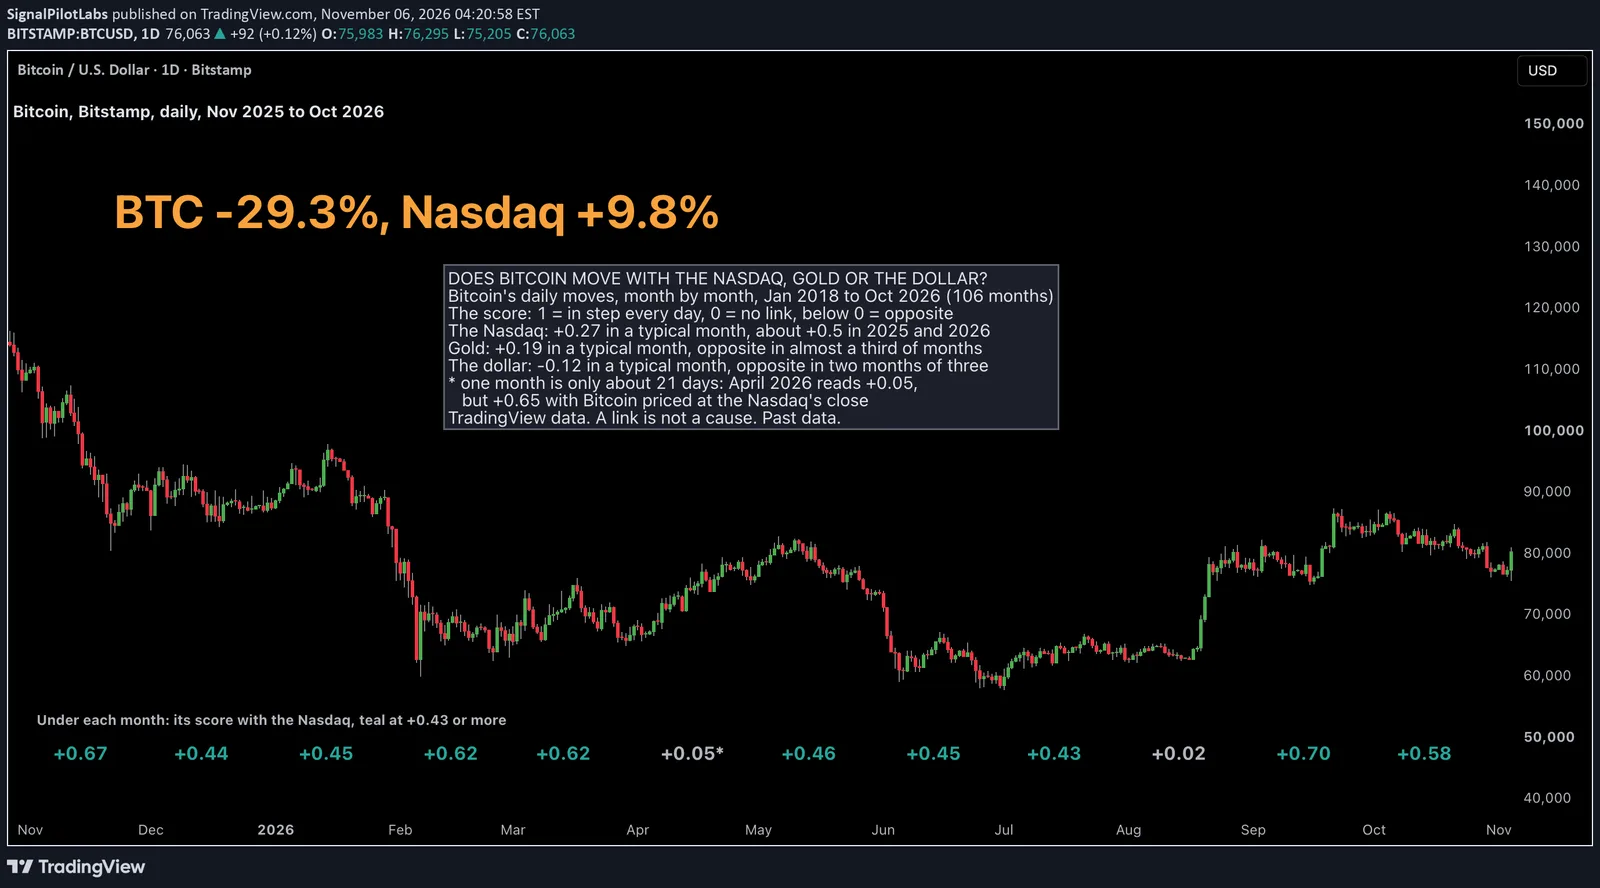
Over the 12 months to October 2026, the Nasdaq 100 rose 9.8% and Bitcoin fell 29.3%. Yet in 10 of those 12 months their daily moves lined up, with a correlation of +0.43 or more. Both things are true, and the gap between them is the most useful thing to know about correlation.
What correlation measures
Correlation compares daily moves, not where a market ends up. A correlation of +1 means two markets moved in step every day, 0 means no link, and -1 means they moved opposite. A month of +0.45 says that on the days the Nasdaq rose, Bitcoin tended to rise too, and on its down days Bitcoin tended to fall. It says nothing about which way either one went over the month, and nothing about why.
What we measured
TradingView daily candles for Bitcoin (Bitstamp), the Nasdaq 100, gold (OANDA) and the US dollar index, January 2018 to October 2026: 106 months. For each month, the correlation of Bitcoin’s daily moves with each market’s, on the days both traded, so Bitcoin’s weekend moves count toward Monday. The rules were written down before any correlation was computed.
| January 2018 to October 2026 | Nasdaq 100 | Gold | Dollar index |
|---|---|---|---|
| Months | 106 | 106 | 106 |
| Median month | +0.27 | +0.19 | -0.12 |
| Months above +0.5 (%) | 26.4 | 11.3 | 0.0 |
| Months below 0 (%) | 16.0 | 31.1 | 67.0 |
| Sign switches, month to month | 20 | 40 | 46 |
What we found
The Nasdaq link was the strongest of the three, and it grew. The median month was +0.27 overall, but about zero in 2018 and 2019, around +0.6 in 2022, and around +0.5 in 2025 and 2026. A quarter of all months were above +0.5.
The dollar link ran the other way. The median month was -0.12, two months in three were below zero, and not one month in 106 was above +0.5. In 2022 the median month was -0.34.
Gold’s link was looser than the Nasdaq’s: a median month of +0.19, below zero in almost a third of months, and above +0.5 in only about one month in ten. Its strongest year was 2026 so far, at +0.40.
| Median month, by year | Nasdaq 100 | Gold | Dollar index |
|---|---|---|---|
| 2018 | +0.06 | +0.01 | -0.01 |
| 2019 | +0.05 | +0.23 | -0.11 |
| 2020 | +0.33 | +0.32 | -0.19 |
| 2021 | +0.22 | -0.02 | -0.11 |
| 2022 | +0.60 | +0.27 | -0.34 |
| 2023 | +0.17 | +0.13 | -0.14 |
| 2024 | +0.33 | +0.18 | -0.14 |
| 2025 | +0.49 | +0.11 | -0.02 |
| 2026, to October | +0.46 | +0.40 | -0.24 |
The last 12 months
| Month | Nasdaq 100 | Gold | Dollar index |
|---|---|---|---|
| November 2025 | +0.67 | +0.73 | -0.24 |
| December 2025 | +0.44 | -0.09 | +0.06 |
| January 2026 | +0.45 | +0.14 | +0.12 |
| February 2026 | +0.62 | +0.46 | -0.40 |
| March 2026 | +0.62 | +0.28 | -0.13 |
| April 2026 | +0.05 | +0.28 | -0.22 |
| May 2026 | +0.46 | +0.30 | -0.12 |
| June 2026 | +0.45 | +0.51 | -0.53 |
| July 2026 | +0.43 | +0.70 | -0.27 |
| August 2026 | +0.02 | +0.54 | -0.52 |
| September 2026 | +0.70 | +0.35 | -0.27 |
| October 2026 | +0.58 | +0.54 | +0.00 |
The Nasdaq link was +0.43 or more in every month but April and August. Gold was above zero in 11 of the 12, and the dollar below zero in 9.
On the chart
Bitcoin, daily, November 2025 to October 2026, each month labelled with its correlation to the Nasdaq, teal where it was +0.43 or more. From about 111,000 in early November 2025 it fell to about 58,000 in July 2026, and ended October at 77,430. Through most of that slide its daily moves still lined up with a rising Nasdaq.
One month shows how noisy a single number is. A month is only about 21 trading days. April 2026 reads +0.05 with Bitcoin priced at its usual 00:00 UTC close, and +0.65 priced at the Nasdaq’s close, 20:00 UTC. In a typical month the timing moved the number by about 0.04; in April it moved it by 0.60.
How to read it
- Read correlation as “do the daily moves line up”, not “do they go the same way”. The last 12 months had both a strong link and opposite results.
- Use more than one month. A single month is about 21 numbers and can swing on a few days.
- Check the sign as well as the size. Against the dollar, Bitcoin’s link has mostly been negative. And if you hold Bitcoin beside Nasdaq stocks, look at this number before you count them as two separate bets: in the ten months at +0.43 or more, they moved the same way on 141 of 208 days, about two in three.
The opposite trap, a low correlation while everything falls together, is in our post on correlation and diversification, on ten altcoins’ worst 4 hour candles.
One day when the dollar index sat still and Bitcoin did not is in our post on Friday’s Bitcoin trap, with oil and yields beside it.
What this does not tell you
Why the markets moved together, or which way any of them goes next. A correlation is not a cause. It doesn’t tell you to buy or to sell. Past data.
Observations, not recommendations.
We’re Signal Pilot Labs. We build the Elite Seven, seven indicators for TradingView, and we post what we measure, including the parts that didn’t work.
See what we build at signalpilot.io.
Published as a TradingView Idea on BTCUSD. View the chart on TradingView
Past measurement described after the fact. Nothing here is a recommendation or an indication of future results.