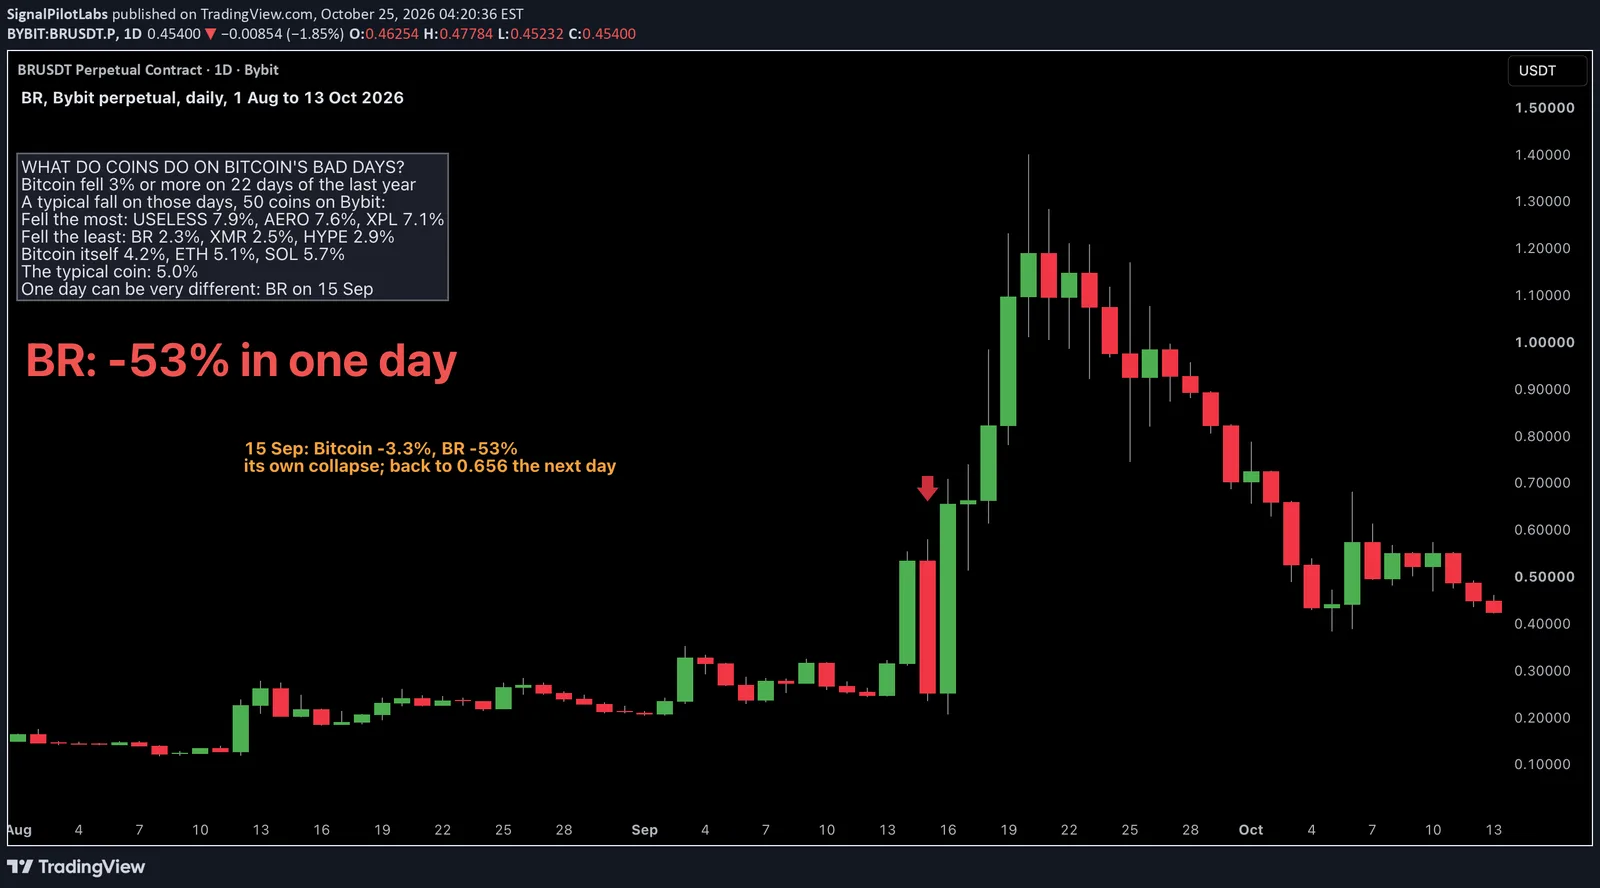
Published as a TradingView Idea on BRUSDT. View the chart on TradingView
Bitcoin had 22 days in the last year when it fell 3% or more. We looked at what 50 coins did on those days, and in the three days after. Every coin is in the table below, so you can find yours.
What we measured
The 50 most traded crypto perpetuals on Bybit, ranked by turnover from 11 September to 10 October 2026, each listed for the whole year. Daily closes, UTC, 14 October 2025 to 13 October 2026. A drop day is a day Bitcoin closed 3% or more below the day before. For each coin, its median move on those 22 days, how many of them it fell more than Bitcoin, and its median move over the next three days against its median over any three days of the year. The rules were written down before the run.
On the drop day
Bitcoin’s own median on those days was minus 4.2%. The median coin fell 5.0%, and 36 of the 50 fell more than Bitcoin.
Fell the most: USELESS 7.9%, AERO 7.6%, XPL 7.1%, FARTCOIN 6.6% and STRK 6.4%. Fell the least: BR 2.3%, XMR 2.5%, HYPE 2.9%, ZRO 2.9% and QNT 3.2%. ETH fell 5.1% and SOL 5.7%, and each fell more than Bitcoin on 18 of the 22 days.
The three days after
They didn’t bounce. Counting every drop day, 44 of the 50 coins did worse in the next three days than in an ordinary three days. Drop days come in runs, though: the 22 fell in 13 runs, so some of that is the next drop day arriving. Counting only the first day of each run, 33 of the 50 still did worse than usual.
| Coin | Median on a drop day (%) | Days deeper than BTC, of 22 | Next 3 days, median (%) | Ordinary 3 days, median (%) |
|---|---|---|---|---|
| USELESS | -7.9 | 16 | -5.2 | -1.8 |
| AERO | -7.6 | 18 | -4.1 | -1.0 |
| XPL | -7.1 | 15 | -7.2 | -1.7 |
| FARTCOIN | -6.6 | 15 | -3.0 | -0.8 |
| STRK | -6.4 | 14 | -0.5 | -1.5 |
| OP | -6.4 | 14 | -2.7 | -1.6 |
| VVV | -6.1 | 14 | -3.9 | +0.3 |
| PUMPFUN | -6.1 | 16 | -5.5 | -0.1 |
| PENGU | -5.9 | 17 | -5.7 | -1.5 |
| ADA | -5.9 | 16 | -2.6 | -1.4 |
| TAO | -5.8 | 14 | -2.4 | -0.9 |
| AAVE | -5.7 | 15 | -2.3 | -0.6 |
| TIA | -5.7 | 14 | -2.1 | -1.6 |
| SOL | -5.7 | 18 | -2.6 | -0.1 |
| WLD | -5.6 | 13 | -1.0 | -1.1 |
| DASH | -5.6 | 13 | -4.3 | -1.5 |
| ENA | -5.4 | 12 | -3.0 | -2.2 |
| ONDO | -5.3 | 13 | -2.7 | -1.3 |
| APT | -5.3 | 12 | -1.9 | -1.3 |
| SUI | -5.2 | 17 | -4.2 | -1.1 |
| ETH | -5.1 | 18 | -1.9 | -0.1 |
| LSK | -5.1 | 14 | -2.2 | -0.7 |
| AVAX | -5.0 | 14 | -2.5 | -0.4 |
| LINK | -5.0 | 15 | -3.3 | -0.3 |
| MOVR | -5.0 | 13 | -3.0 | -1.7 |
| FIL | -5.0 | 13 | -1.3 | -1.0 |
| ARB | -4.7 | 14 | -3.6 | -1.5 |
| SAND | -4.7 | 14 | -2.1 | -0.9 |
| UNI | -4.7 | 12 | +0.7 | -0.6 |
| INJ | -4.6 | 13 | -2.6 | -0.4 |
| 1000PEPE | -4.4 | 13 | -3.6 | -1.3 |
| ZEC | -4.4 | 12 | -1.5 | -0.1 |
| XRP | -4.4 | 10 | -1.3 | -0.9 |
| HBAR | -4.3 | 10 | -0.7 | -0.7 |
| NEAR | -4.3 | 13 | -2.0 | -0.6 |
| DOT | -4.2 | 11 | -3.6 | -2.0 |
| BTC | -4.2 | 0 | -1.1 | +0.0 |
| DOGE | -4.0 | 10 | -1.3 | -0.9 |
| RLC | -3.9 | 10 | -0.5 | -0.5 |
| XLM | -3.8 | 9 | -0.6 | -1.2 |
| TRUMP | -3.7 | 8 | -2.9 | -1.6 |
| BNB | -3.6 | 7 | -1.8 | +0.0 |
| LTC | -3.6 | 9 | -0.7 | -0.6 |
| BCH | -3.5 | 12 | -0.5 | -0.6 |
| AKE | -3.3 | 9 | -8.9 | -1.7 |
| QNT | -3.2 | 10 | -0.7 | -0.7 |
| ZRO | -2.9 | 10 | -4.4 | +0.1 |
| HYPE | -2.9 | 7 | -0.8 | +0.1 |
| XMR | -2.5 | 9 | +0.7 | +0.9 |
| BR | -2.3 | 6 | -0.1 | -1.0 |
The chart
The last drop day of the year we measured, 15 September 2026, Bitcoin minus 3.3%. The coin that fell most that day was BR, minus 53%, from 0.535 to 0.252. That was BR’s own collapse inside Bitcoin’s bad day, and it closed at 0.656 the next day. It is also the coin with the smallest median drop in the table. A median says what usually happens; it doesn’t stop one day from being very different.
How far each coin dips before a move works, in percent and in ATR, is in our post on how far your coin dips, with the same 50 coins.
What this does not tell you
Why, or what comes next. 22 days in 13 runs is a small sample, one year, one exchange, daily closes. The median hides single days like BR’s. It isn’t a signal to sell anything.
What it’s good for is knowing how your coin has tended to move when Bitcoin has a bad day, before the next one.
Before the next drop day
Find your coin in the table and multiply its drop-day median by your position. USELESS’s 7.9% is about $79 on $1,000; BR’s 2.3% is about $23. That is a typical drop day, not the worst: BR lost 53% on one of them.
Observations, not recommendations.
We’re Signal Pilot Labs. We build the Elite Seven, seven indicators for TradingView, and we post what we measure, including the parts that didn’t work.
See what we build at signalpilot.io.
Published as a TradingView Idea on BRUSDT. View the chart on TradingView
Past measurement described after the fact. Nothing here is a recommendation or an indication of future results.