Published as a TradingView Idea on XRPUSDT. View the chart on TradingView
Augury Grid scans 7 coins on 3 timeframes and shows the top 7 of its 21 rows. Does its order put the next row to turn in front of you? Since v1.1 it ranks them like a watchlist: rows reading Bull or Bear lead, the best score on top, then the rows with a status, the closest to turning ahead of the rest. We measured it.
How the table orders its rows
Rows reading Bull or Bear come first, by score, and the newer one wins a tie. A row that agrees with the same coin’s row on another timeframe gets a bonus and carries Augury’s link mark. Then come the rows with a status, by how close they are: ⏳ MACD first (only the cross is missing), then ⏳ EMA200, ⏳ ADX and ⏳ Trend. The arrow, ▲ or ▼, shows the side the row would turn. What each status means is in our post on the status column, with its AVAX example.
What we measured
The whole table replayed on every 15 minute close with the script’s own rules: Augury’s seven coins (BTC, ETH, SOL, BNB, XRP, ADA, AVAX) on 15 minutes, 4 hours and daily, October 2024 to October 2026. For every row that turned Bull or Bear: was it already on the table just before it turned? The test and its pass mark were written down before the run.
What we found
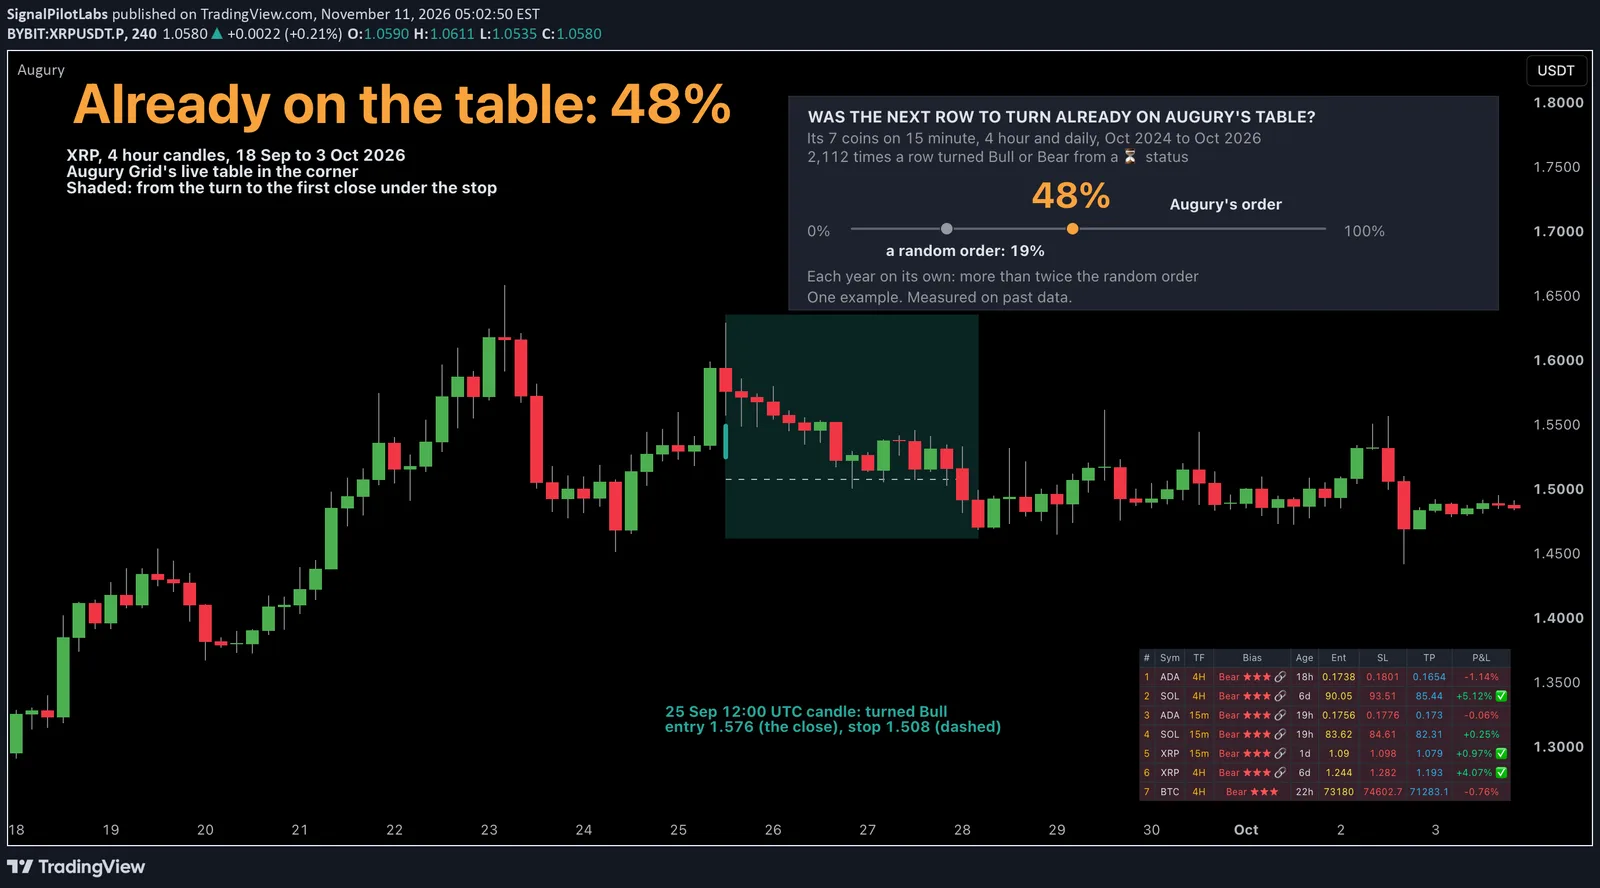
2,898 times a row turned Bull or Bear. 786 of those rows already read Bull or Bear, a newer reading replacing the old one. The other 2,112 came from rows with a status, and 48.0% of those rows were already on the table. If the rows with a status had been in random order, 18.9% would have been.
| Year | Rows that turned from a status | Already on the table (%) | Random order (%) | Lift |
|---|---|---|---|---|
| Oct 2024 to Oct 2025 | 1,055 | 50.8 | 19.0 | 2.67 |
| Oct 2025 to Oct 2026 | 1,057 | 45.1 | 18.8 | 2.40 |
| Both years | 2,112 | 48.0 | 18.9 | 2.54 |
It held in both years: 50.8% against 19.0% from October 2024, and 45.1% against 18.8% from October 2025.
Almost all of those rows read ⏳ MACD: 970 of 1,013. And the table usually had room for them. On 86% of 15 minute closes it held at least one row with a status, and the median close (the middle one) had three.
On the chart
XRP, 4 hour, 18 September to 3 October 2026. At 15:45 UTC on 25 September the table showed two Bull rows, XRP daily and SOL 4H, then five ⏳ MACD ▲ rows. XRP 4H was the last of them, row 7.
It turned at the next 4 hour close: Bull on the 12:00 candle, with an entry at 1.576 and a stop at 1.508. The dashed line runs to the candle that closed under the stop on 28 September. XRP’s daily row read Bull too, so the new row carried Augury’s link mark. ADA 4H turned at the same close, from a row the table wasn’t showing, which is the other half of the number above.
It’s one example, picked by a rule: the most recent 4H row that was on the table just before it turned. The numbers above cover all seven coins and three timeframes.
How to do it
- Add Augury Grid v1.2. If it was on your chart before 17 October, remove it and add it again.
- Read the top rows, the ones reading Bull or Bear, best score first.
- Read the rows under them as your shortlist. ⏳ MACD rows are the ones nearest to turning.
- Use the arrow for the side the row would turn.
What this does not tell you
Where the next Bull or Bear row came from, not how it did. Augury’s seven coins, past data.
Observations, not recommendations.
We’re Signal Pilot Labs. We build the Elite Seven, seven indicators for TradingView, and we post what we measure, including the parts that didn’t work.
See what we build at signalpilot.io.
Published as a TradingView Idea on XRPUSDT. View the chart on TradingView
Past measurement described after the fact. Nothing here is a recommendation or an indication of future results.