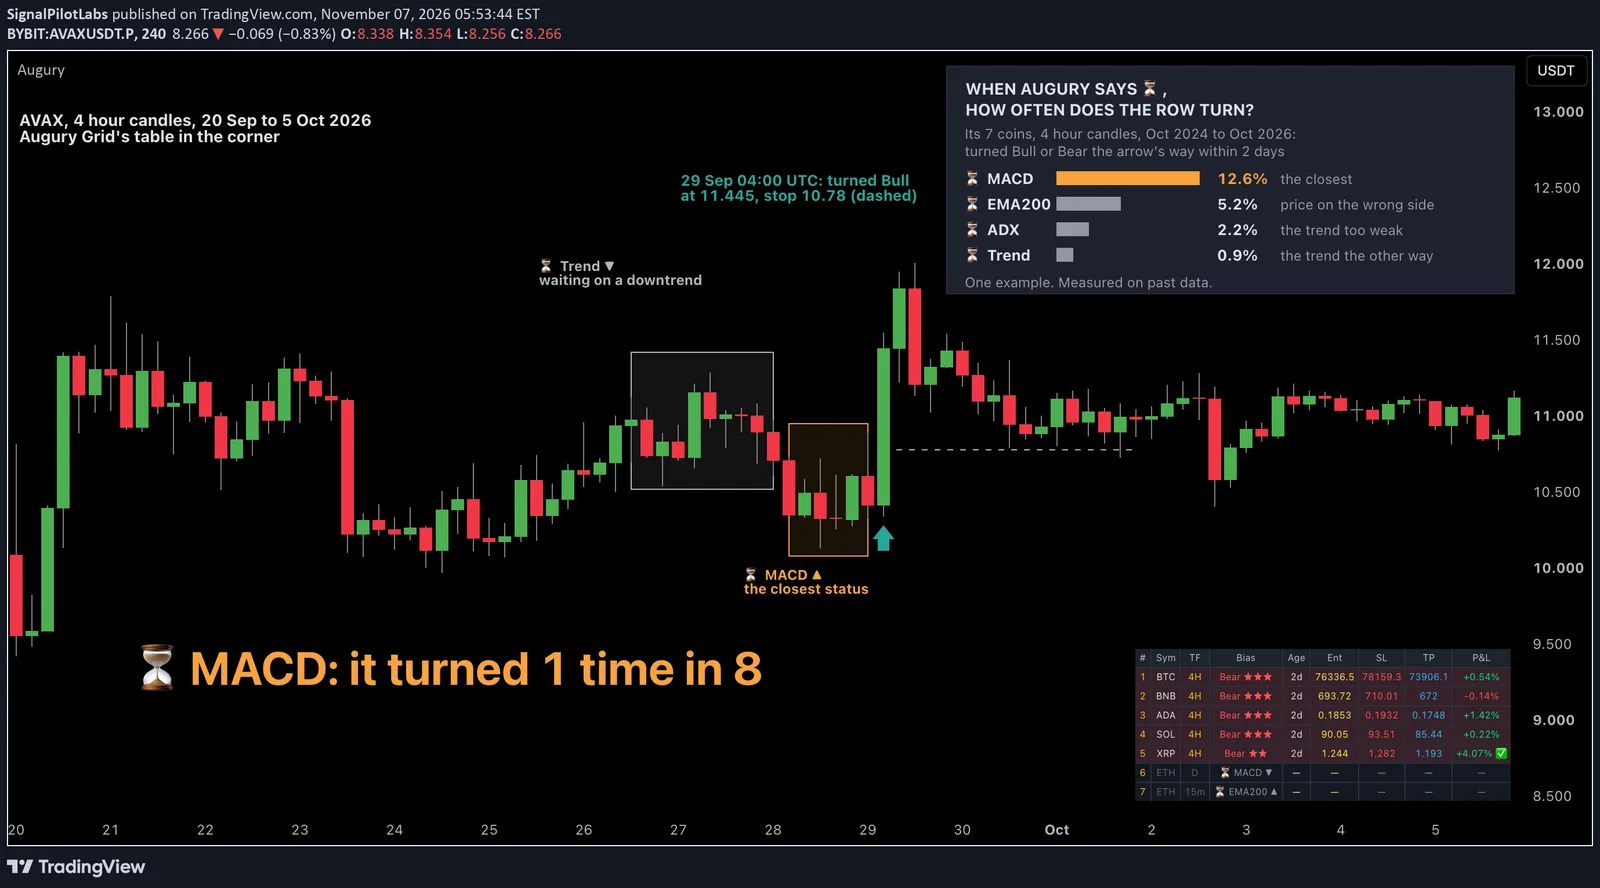
Published as a TradingView Idea on AVAXUSDT. View the chart on TradingView
Augury Grid scans 7 coins on 3 timeframes (15 minutes, 4 hours, daily) and ranks the 21 results in one table. When a row reads neither Bull nor Bear, its Bias column shows a status instead. We measured what that status tells you.
Before you start
This is the status column as it works from Augury Grid v1.1. In v1.0 the column showed 💀 SL Hit or 💀 Stale on almost every candle, so the hints below never reached the table. v1.1 fixes that. If Augury Grid was already on your chart, remove it and add it again to get v1.2.
What the status means
A row turns Bull or Bear only when everything Augury checks lines up on the same candle: the trend, price on the right side of the EMA 200, trend strength (the ADX Minimum setting, 20 by default), MACD, volume, momentum, and a quality score of at least 70 (the Min Score setting).
The status shows the first one still missing, with ▲ or ▼ for the side the row would turn.
What we measured
Augury’s own seven coins (BTC, ETH, SOL, BNB, XRP, ADA, AVAX), the 4 hour column, October 2024 to October 2026, replayed with the script’s own rules: 30,660 candles. For each status, how often the row turned that way within 6 candles, one day, and within 12 candles, two days.
What we found
| Status | What it means | Candles | Turned within 1 day (%) | Turned within 2 days (%) |
|---|---|---|---|---|
| ⏳ MACD | The closest: the trend, the EMA 200 and ADX are in place | 6,303 | 7.5 | 12.6 |
| ⏳ ADX | The trend is too weak, ADX under 20 | 3,600 | 1.2 | 2.2 |
| ⏳ EMA200 | Price is on the wrong side of the EMA 200 | 2,805 | 3.2 | 5.2 |
| ⏳ Trend | The trend is on the other side | 11,626 | 0.6 | 0.9 |
⏳ MACD was by far the closest: the row turned about 14 times as often as after ⏳ Trend. Even so, after seven in eight ⏳ MACD candles the row hadn’t turned within two days, because a turn also needs volume, momentum and the score on that same candle.
Most of the time the column read ⏳ Trend (37.9% of candles), then ⏳ MACD (20.6%), Bull or Bear (19.5%), ⏳ ADX (11.7%) and ⏳ EMA200 (9.1%).
In v1.0, on the same candles, the column read Bull or Bear 38.2% of the time, 💀 SL Hit 40.2% and 💀 Stale 21.6%: no hint at all. That was our mistake, and v1.1 is the fix.
On the chart
AVAX, 4 hour, 20 September to 5 October 2026. AVAX was in an uptrend, above its EMA 200. The status read ⏳ Trend ▼ (grey box): the row’s next turn would have been Bear, and a Bear reading needs a downtrend.
At 04:00 UTC on 28 September the status switched to ⏳ MACD ▲: the next turn was now Bull, and the trend, the EMA 200 and ADX were all in place. It read that way for six candles (orange box).
At 04:00 on 29 September, on a 10% candle with volume, the row turned Bull at the close, 11.445, with its stop 1.5 ATR below at 10.78 (dashed line).
It’s one example, picked by a rule: the most recent Bull or Bear reading whose status read ⏳ MACD on the candle before it and something else in the two days before that. The sequence is the same on Bybit and Binance candles. The numbers above cover all seven coins.
How to do it
- Add Augury Grid v1.2. Rows that read neither Bull nor Bear show a status in the Bias column.
- Read the arrow first. ▲ means the row would turn Bull, ▼ Bear.
- Read the status as distance. ⏳ Trend is the furthest, ⏳ ADX and ⏳ EMA200 sit in between, ⏳ MACD is the closest.
- Rows with a status are listed closest first, so ⏳ MACD rows sit above ⏳ EMA200, ⏳ ADX and ⏳ Trend.
What this does not tell you
It measures how close a row was to turning Bull or Bear, not how those readings did afterwards. One timeframe, Augury’s own seven coins, past data.
Observations, not recommendations.
We’re Signal Pilot Labs. We build the Elite Seven, seven indicators for TradingView, and we post what we measure, including the parts that didn’t work.
See what we build at signalpilot.io.
Published as a TradingView Idea on AVAXUSDT. View the chart on TradingView
Past measurement described after the fact. Nothing here is a recommendation or an indication of future results.