Published as a TradingView Idea on BTCUSDT. View the chart on TradingView
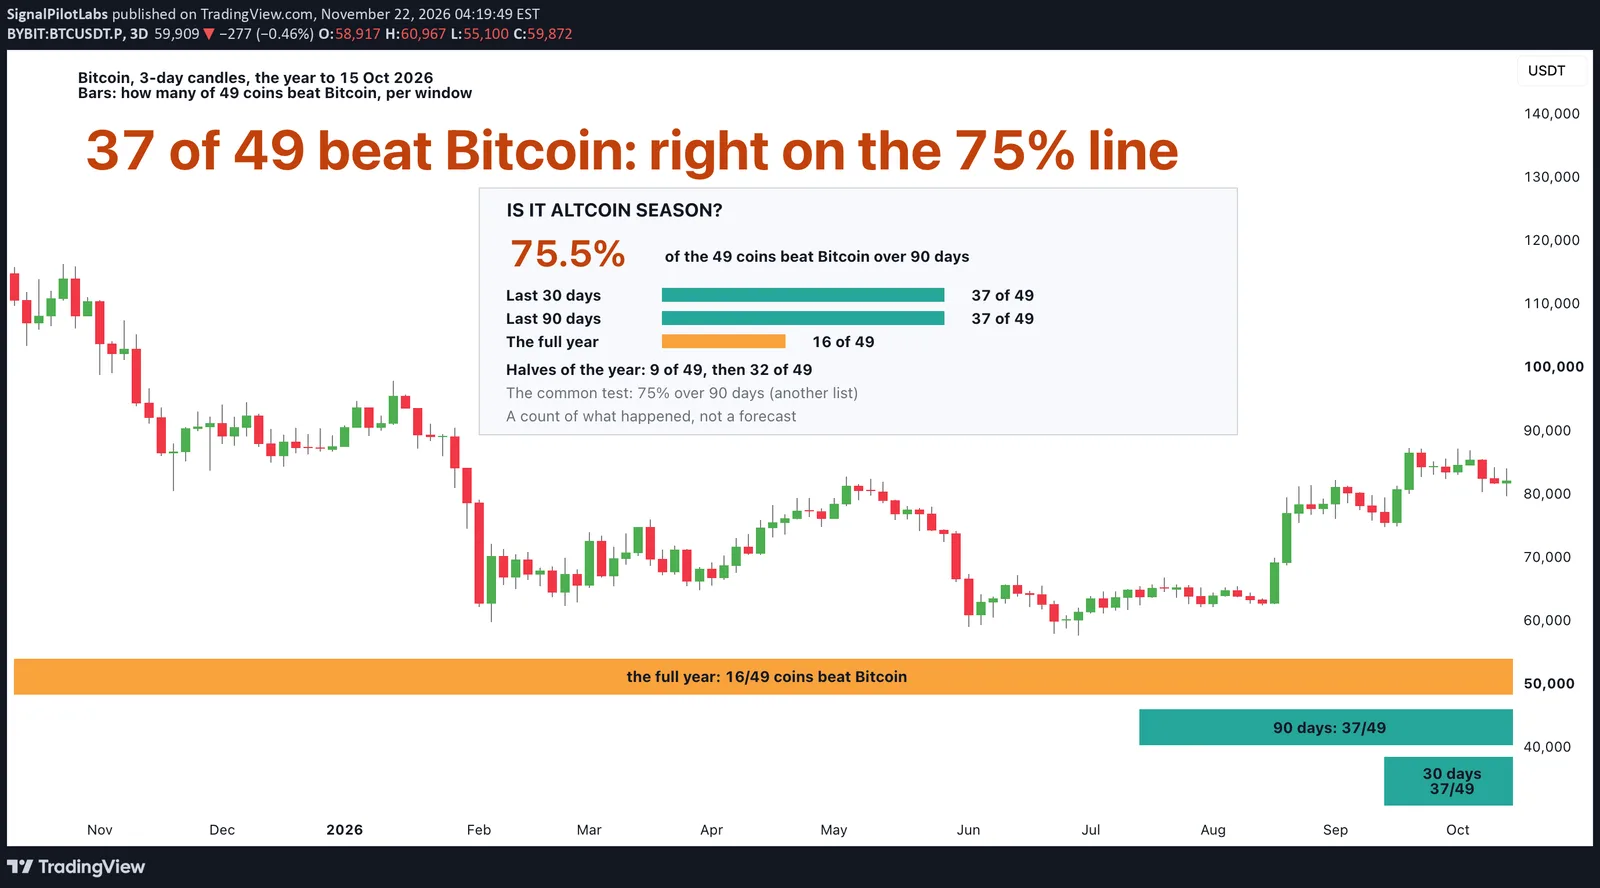
Is it altcoin season? We counted how many of 49 coins beat Bitcoin over the last 30 days, the last 90 days and the full year, all ending 15 October 2026.
What we measured
Bybit daily closes for Bitcoin and 49 other coins. For each window, a coin’s return is its close on 15 October 2026 against its close 30, 90 or 365 days earlier. A coin beat Bitcoin if it rose more, or fell less, over the same window.
What we found
Over 30 days Bitcoin rose 8.7%, and 37 of the 49 coins beat it (75.5%). The median coin (the middle one of the 49) rose 22.1%. QNT led at +234.9%.
In the last 90 days Bitcoin rose 28.6%, and again 37 of 49 beat it. The typical coin rose 44.6%.
Across the full year Bitcoin fell 25.8%, and only 16 of 49 beat it. The typical coin fell 38.7%, ETH by 38.7% and SOL by 45.6%.
Twelve coins beat Bitcoin in all three windows: AERO, AKE, BR, INJ, NEAR, PUMPFUN, QNT, RLC, UNI, VVV, ZEC and ZRO. Six beat it in none: BNB, DOGE, TRUMP, XLM, XPL and XRP.
| Coin | 30 days (%) | 90 days (%) | 365 days (%) |
|---|---|---|---|
| BTC | +8.7 | +28.6 | -25.8 |
| AKE | +22.1 | +2,178.1 | +1,623.7 |
| QNT | +234.9 | +214.6 | +135.4 |
| STRK | +225.5 | +210.5 | -27.0 |
| RLC | +219.2 | +203.9 | -0.9 |
| USELESS | -20.0 | +183.7 | -52.3 |
| PUMPFUN | +29.1 | +177.6 | +18.5 |
| NEAR | +125.5 | +173.3 | +126.5 |
| ZRO | +109.5 | +167.6 | +13.0 |
| ENA | +46.8 | +150.1 | -51.2 |
| BR | +43.0 | +139.1 | +509.1 |
| LSK | -42.4 | +137.3 | -14.1 |
| ZEC | +10.1 | +123.2 | +431.5 |
| VVV | +16.3 | +121.4 | +1,450.8 |
| ARB | +29.1 | +115.9 | -40.1 |
| UNI | +16.8 | +104.2 | +13.1 |
| AERO | +78.4 | +99.8 | +14.4 |
| AAVE | +29.0 | +75.1 | -35.0 |
| XMR | +8.4 | +66.1 | +73.4 |
| INJ | +57.1 | +66.0 | -5.6 |
| TIA | +81.3 | +55.9 | -44.8 |
| AVAX | +38.1 | +52.5 | -54.1 |
| FIL | +42.4 | +51.9 | -27.5 |
| LINK | +14.5 | +51.0 | -31.0 |
| 1000PEPE | +20.6 | +49.0 | -43.1 |
| DASH | -1.7 | +44.6 | +8.8 |
| TAO | +28.1 | +43.4 | -32.2 |
| OP | +46.9 | +43.2 | -69.8 |
| SOL | +8.8 | +40.5 | -45.6 |
| SUI | +51.0 | +40.1 | -61.3 |
| ADA | +17.7 | +38.0 | -65.6 |
| HYPE | +6.3 | +36.9 | +118.7 |
| DOT | +21.8 | +35.4 | -63.3 |
| LTC | +19.1 | +35.2 | -36.1 |
| APT | +52.6 | +34.3 | -76.3 |
| ETH | +1.8 | +32.6 | -38.7 |
| WLD | +39.8 | +30.4 | -45.7 |
| HBAR | +14.7 | +29.2 | -52.4 |
| BNB | +2.5 | +28.5 | -37.3 |
| PENGU | +11.2 | +28.3 | -67.2 |
| BCH | +28.4 | +26.7 | -46.7 |
| ONDO | +42.8 | +25.6 | -38.6 |
| XRP | +4.0 | +22.6 | -44.6 |
| TRUMP | +0.3 | +21.4 | -68.9 |
| SAND | +67.6 | +17.2 | -74.0 |
| FARTCOIN | +12.7 | +17.0 | -60.7 |
| DOGE | +1.3 | +11.8 | -58.6 |
| MOVR | +78.5 | +9.0 | -65.9 |
| XPL | +4.7 | +0.6 | -81.6 |
| XLM | +4.0 | -1.4 | -43.6 |
The two halves of the year
We split the year after the first count, a check that was not in the plan, and the halves disagree. From 15 October 2025 to 15 April 2026 Bitcoin fell 32.5%, and only 9 of 49 coins beat it. From 15 April to 15 October 2026 it rose 9.9%, and 32 of 49 did.
Is it altcoin season?
The usual line, from a widely quoted index, is 75% of the top coins beating Bitcoin over 90 days. Our 37 of 49 is 75.5%, right on that line. Our 49 Bybit coins aren’t that index’s list, so this is a nearby reading, not the index. And the year tells another story: two thirds of the coins did worse than Bitcoin.
This is a count, not a test: we ran no shuffle, so it says nothing about whether a quarter like this comes up by chance.
Beating Bitcoin is not the same as moving with it. Our post on how tied each coin is to Bitcoin measures the other half.
On the chart
Bitcoin on 3-day candles, 15 October 2025 to 15 October 2026; the first build drew daily candles too thin to read, and the numbers are unchanged. Three bars along the bottom mark the windows, each with its count: teal where most of the 49 coins beat Bitcoin, orange where most did not. The scoreboard holds the 90-day share, the three counts and the halves.
How to run the count on your own list
- Pick your coins and one end date, and take each coin’s close on that date.
- For each window, take the close that many days earlier and work out the return.
- Do the same for Bitcoin, then count the coins with a higher return.
- Run all three windows. A short window and a long one can disagree.
What this does not tell you
Whether it lasts. A count over a window says what already happened, not what comes next, and 30 and 90 days are short. Past data.
Observations, not recommendations.
We’re Signal Pilot Labs. We build the Elite Seven, seven indicators for TradingView, and we post what we measure, including the parts that didn’t work.
See what we build at signalpilot.io.
Published as a TradingView Idea on BTCUSDT. View the chart on TradingView
Past measurement described after the fact. Nothing here is a recommendation or an indication of future results.