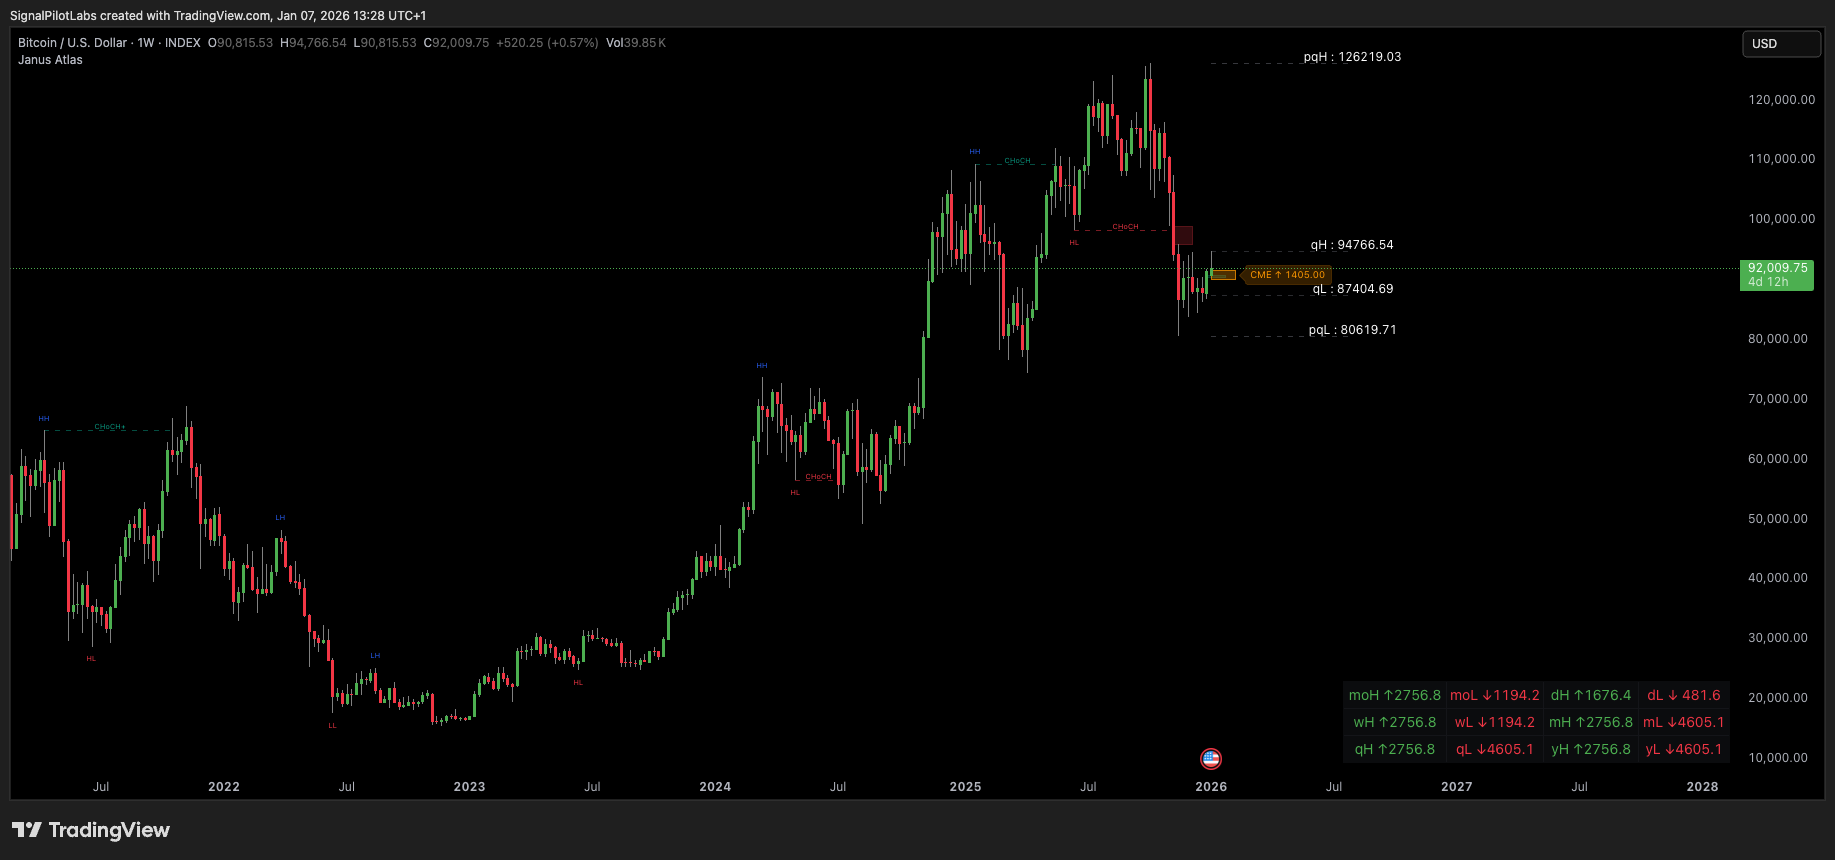
The problem
Levels are the least glamorous and most reliable part of chart work, and drawing them by hand is where most people quietly give up. Daily and weekly opens, session highs, prior POCs, unfilled gaps. By the time you have marked them on one chart the setup on another has already moved.
So people mark three levels instead of thirty, and then wonder why price reacted somewhere they were not looking.
What it shows
Janus Atlas maps over sixty level types automatically, grouped into ten categories, and updates them as sessions roll.
| Category | Includes |
|---|---|
| Classic timeframe levels | Daily, weekly, monthly, quarterly, yearly highs, lows, opens, closes, midpoints, pivots |
| VWAP family | Current and previous period VWAPs with ±1σ and ±2σ bands |
| Volume profile | POC, VAH, and VAL across five timeframes |
| Naked POC | Prior session POCs price has not yet returned to |
| Session levels | Asian, London, and New York highs, lows, opens, closes |
| Market structure | Swing highs and lows, break of structure, change of character |
| Opening range | High, low, and midpoint, configurable from 5 to 60 minutes |
| Gaps | Daily, weekend, and CME futures gaps with fill detection |
| Fair value gaps | Bullish and bearish FVG detection |
Confluence is the point
A level nobody else is watching is not a level. The value is in the overlap, and the overlap is what gets highlighted.
Non-repainting, and what that means here
Every marker is confirmed at bar close and stays where it printed. What you see in history is exactly what you would have seen live, and that is the only way a backtest of your own eyes means anything.
What it isn’t
Levels are where reactions become more likely, not where they are guaranteed. Janus Atlas draws the map. It does not tell you which road to take.
Who it’s for
Traders who know levels matter, and who have quietly stopped drawing most of them because the maintenance is not sustainable across more than one or two charts.
On a real chart
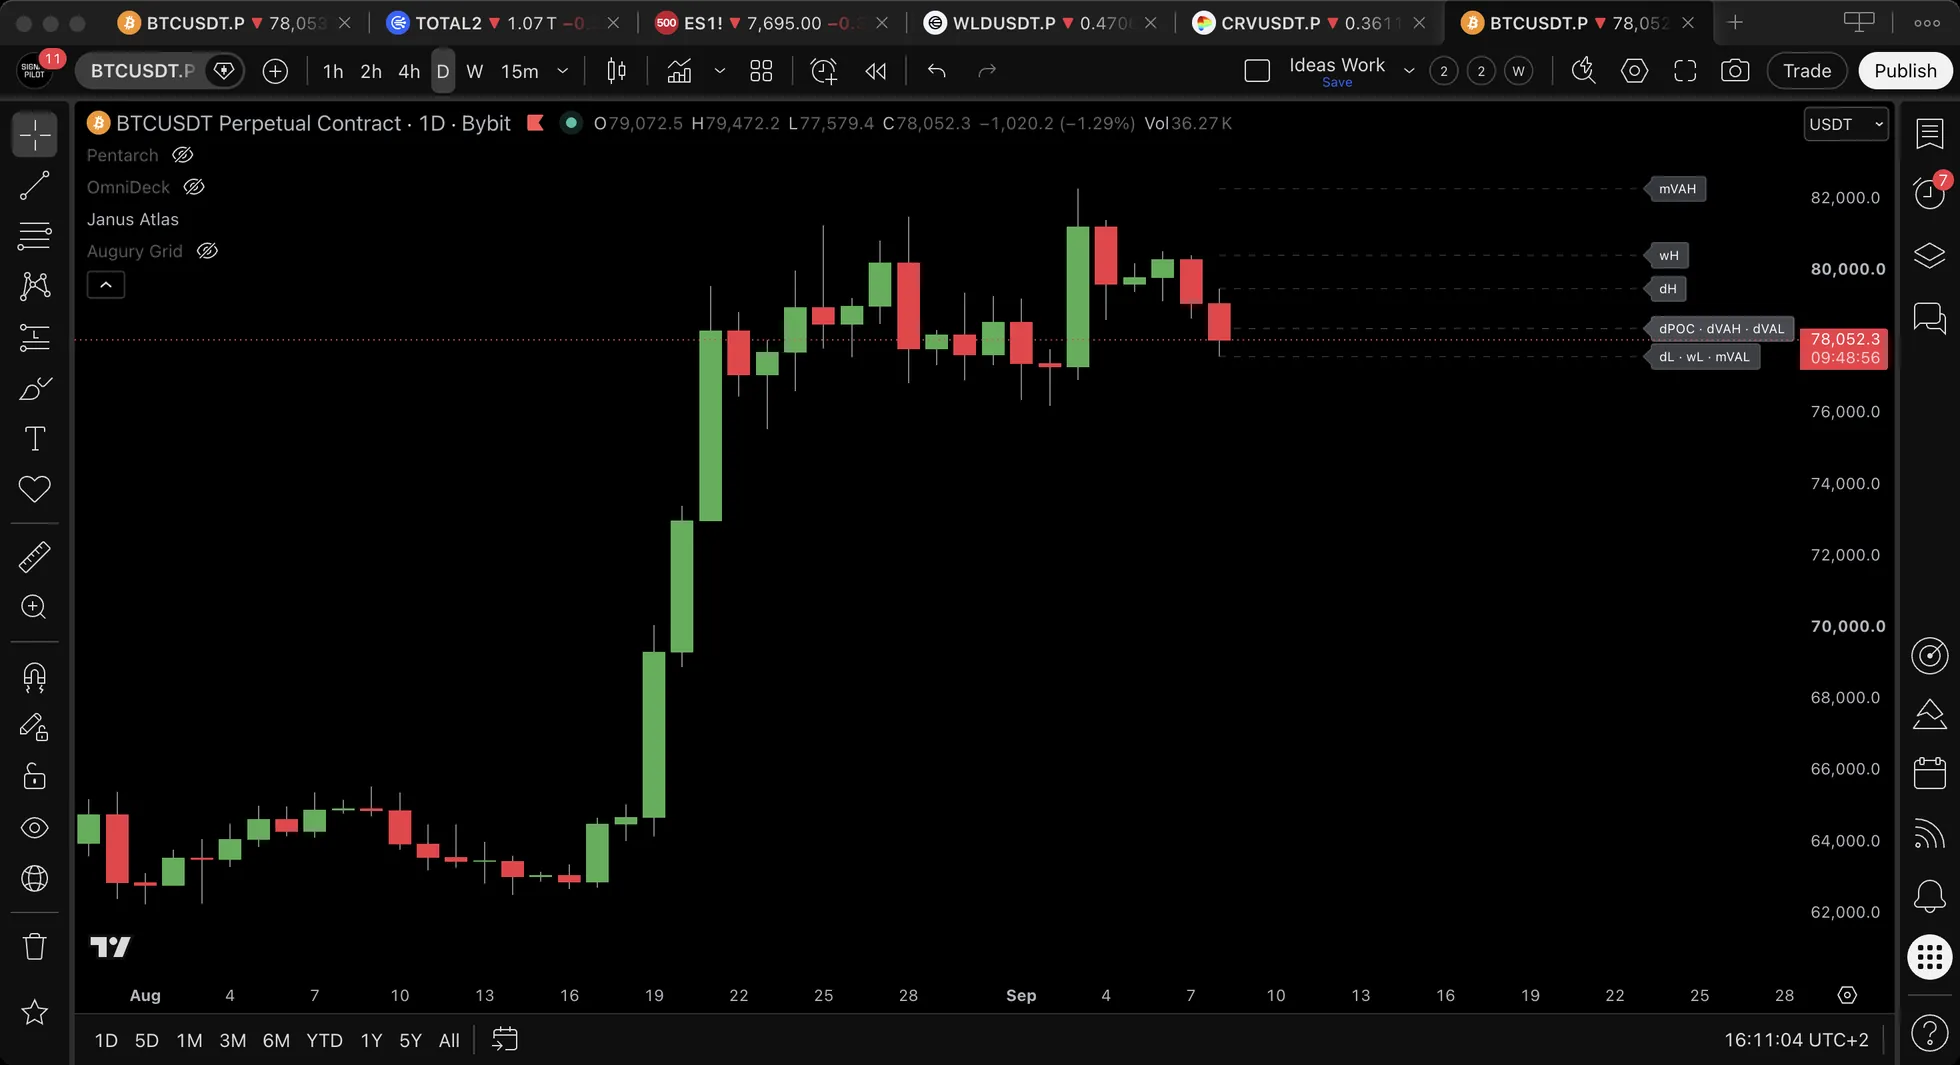
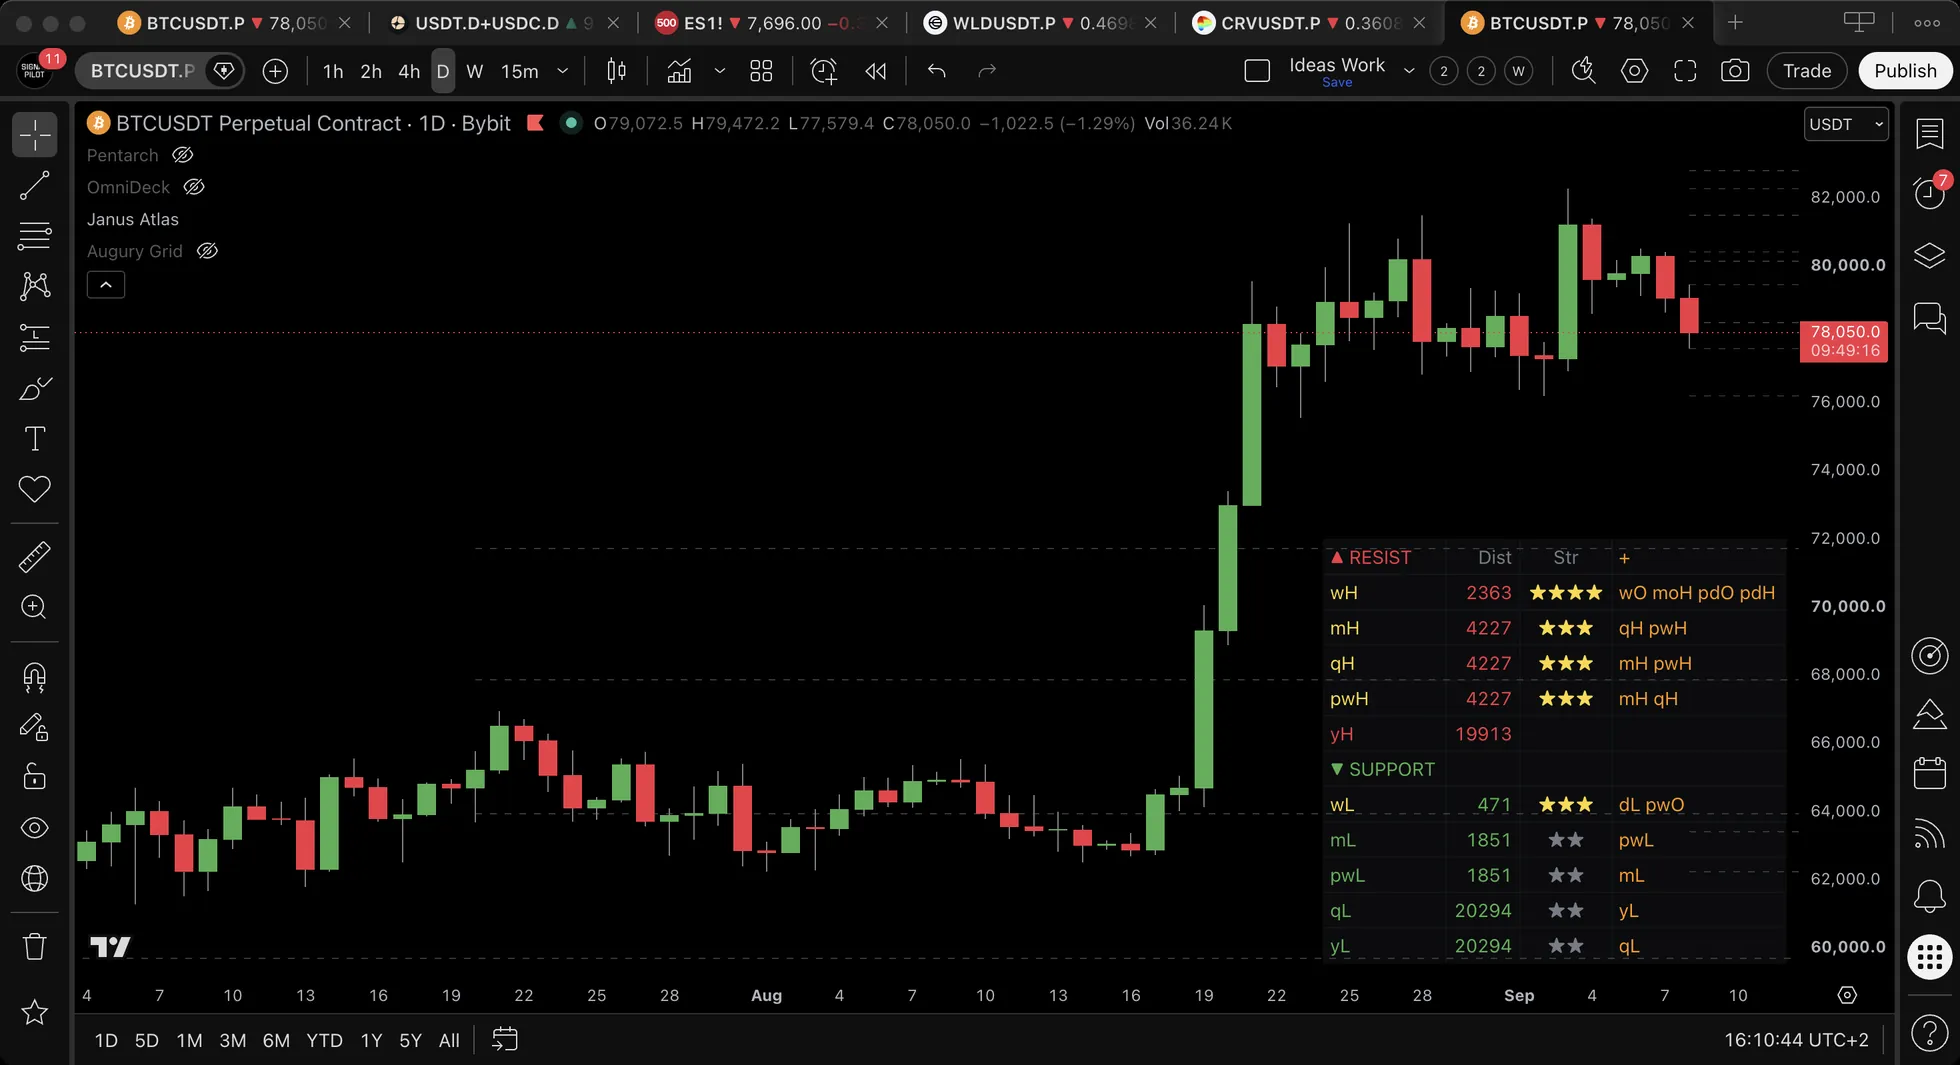
Every setting, every output and every panel is documented in the reference for this indicator.
What we tested
We publish our own measurements of this indicator, including the ones that did not go our way.
Try Janus Atlas
7-day free trial, no credit card. 7-day money-back guarantee. All future updates included, plus 100 free lessons in the education hub.
Part of The Elite Seven. More on cycle structure in Insights and the Chronicle.