Published as a TradingView Idea on USOIL. View the chart on TradingView
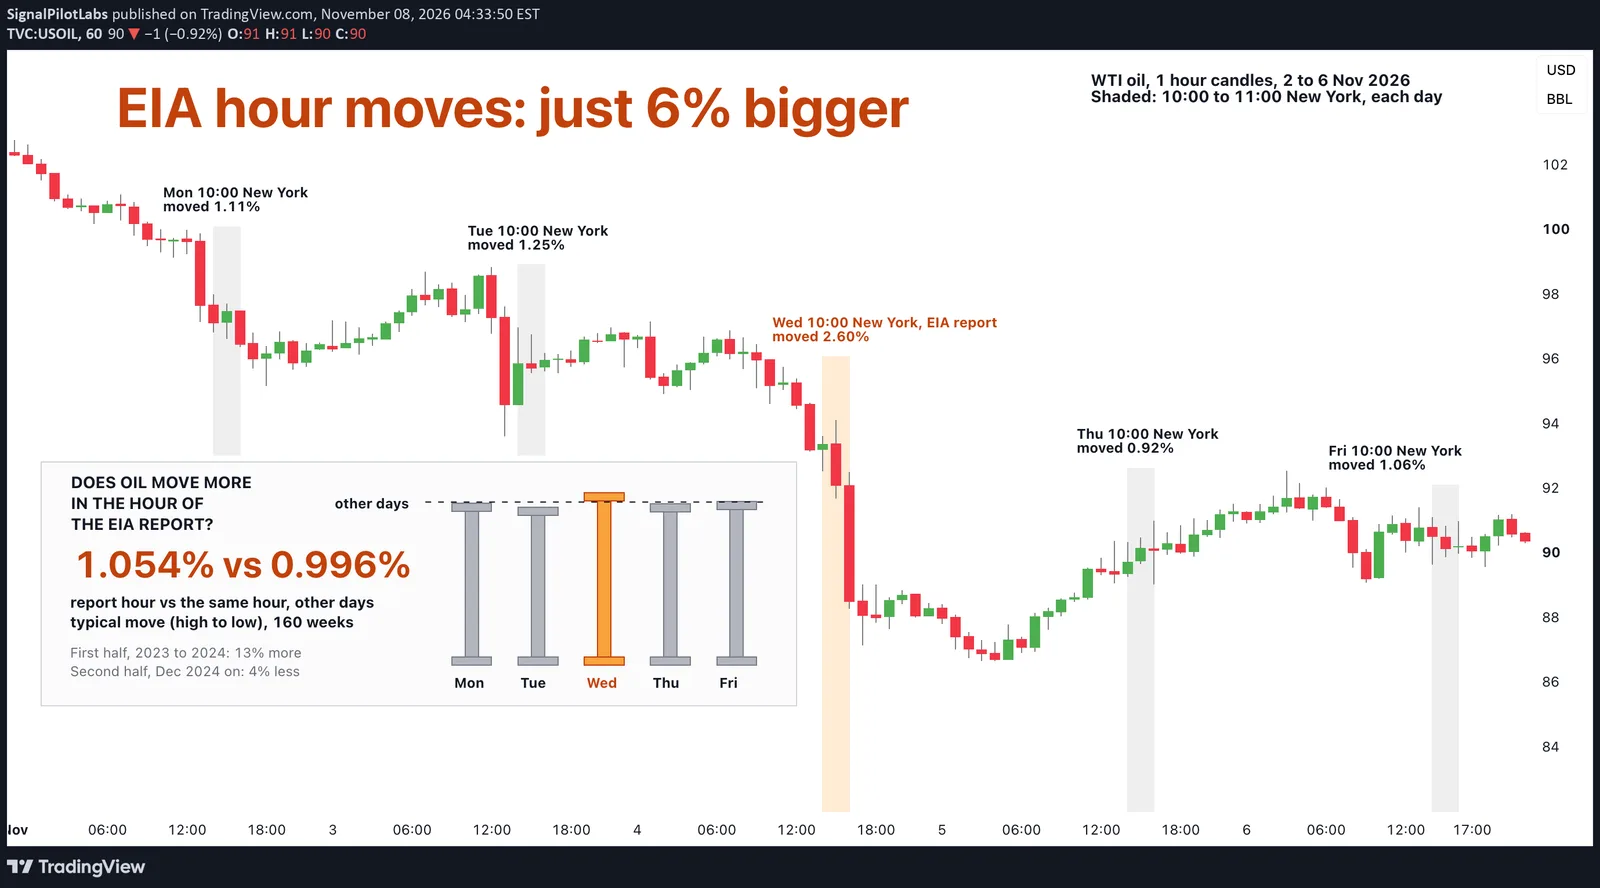
Does WTI crude move more in the hour of the EIA report? Across 160 weeks, only 6% more than the same hour on an ordinary day. It comes out every Wednesday at 10:30 New York time: the US Energy Information Administration’s weekly oil inventory report, one of the most watched releases in energy.
What we measured
TradingView’s WTI chart (TVC:USOIL), 1 hour candles, January 2023 to November 2026. For each weekday we took the 10:00 to 11:00 New York candle and its range, high to low, as a share of its open. Wednesday’s holds the report. We dropped every week with a US federal holiday, because the report moves those weeks: 40 weeks dropped, 160 ordinary weeks kept. The rules were written down before any hour was computed.
| January 2023 to November 2026, 160 ordinary weeks | The report (Wednesday) | Other weekdays | Ratio |
|---|---|---|---|
| 10:00 to 11:00 New York, median range (%) | 1.054 | 0.996 | 1.06 |
| The whole trading day, median range (%) | 3.04 | 2.89 | 1.05 |
| 10:30 to 10:45 New York, median range (%), from December 2025 | 0.66 | 0.62 | 1.07 |
| 10:30 to 10:45 New York, median ticks, from December 2025 | 3390 | 2638 | 1.29 |
What we found
In a typical week (the median, the middle case), the report hour moved 1.054%. On the other four weekdays, the same hour moved 0.996%. That’s only 6% more.
That report hour was the widest 10:00 hour of its week 22% of the time. Luck alone would make it the widest one 20% of the time, one day in five.
The whole report day moved 5% more than an ordinary day, by median range: 3.04% against 2.89%.
| 10:00 to 11:00 New York, median range (%) | All 160 weeks | The last 12 months |
|---|---|---|
| Monday | 0.99 | 1.10 |
| Tuesday | 0.96 | 1.24 |
| Wednesday, the report | 1.05 | 1.07 |
| Thursday | 0.99 | 1.27 |
| Friday | 1.00 | 1.06 |
But the two halves of the record disagree. Over the first half, 2023 to 2024, the report hour moved 13% more than other days; over the second, since December 2024, 4% less. And in the last 12 months it was smaller than an ordinary 10 a.m.: 1.07% against 1.18%. Thursday’s 10 a.m. hour had the widest median range of the week, 1.27%.
The 15 minutes after the release
The report lands in the middle of the hour, so an hour could dilute it. We also checked the 15 minute candle from 10:30, from December 2025, across 39 ordinary weeks. Its median range was 0.66% on Wednesdays against 0.62% on other days, 7% wider.
The trading count, TradingView’s tick volume, was 29% higher: a median of 3,390 ticks against 2,638. So the report clearly draws activity. It just doesn’t move WTI much further than an ordinary morning already does.
On the chart
WTI, 1 hour, the week of 2 November 2026, with the 10:00 New York hour shaded every day. Monday’s ranged 1.11%, Tuesday’s 1.25%, Wednesday’s report hour 2.60%, Thursday’s 0.92% and Friday’s 1.06%. This time the report hour was the widest of the five.
It’s one week, picked by a rule we wrote before looking: the most recent ordinary week. Across all 160 weeks, five pillars under the candles stand as tall as each weekday’s typical 10:00 hour, with the other days’ height dashed across them. Wednesday’s pillar pokes just above that line.
How to read it
- Compare a release hour with the same hour on other days. That’s the move it would have had anyway.
- Look at range and activity separately. The 15 minutes after the report drew 29% more ticks but only 7% more range.
- Remember that a median is the middle week, not every week. Some reports do move oil a lot.
A day when oil and the 10-year yield moved while the dollar index sat still is in our post on Friday’s Bitcoin trap, after a US jobs report.
One of our indicators on the same chart is in our post on Plutus’s breaches on WTI crude oil, which reads the same market on the 4 hour chart.
What this does not tell you
Which way oil goes after a report, or that a given report won’t move it a lot. Some do. It doesn’t tell you to buy or to sell. Past data.
Observations, not recommendations.
We’re Signal Pilot Labs. We build the Elite Seven, seven indicators for TradingView, and we post what we measure, including the parts that didn’t work.
See what we build at signalpilot.io.
Published as a TradingView Idea on USOIL. View the chart on TradingView
Past measurement described after the fact. Nothing here is a recommendation or an indication of future results.