Published as a TradingView Idea on AKEUSDT. View the chart on TradingView
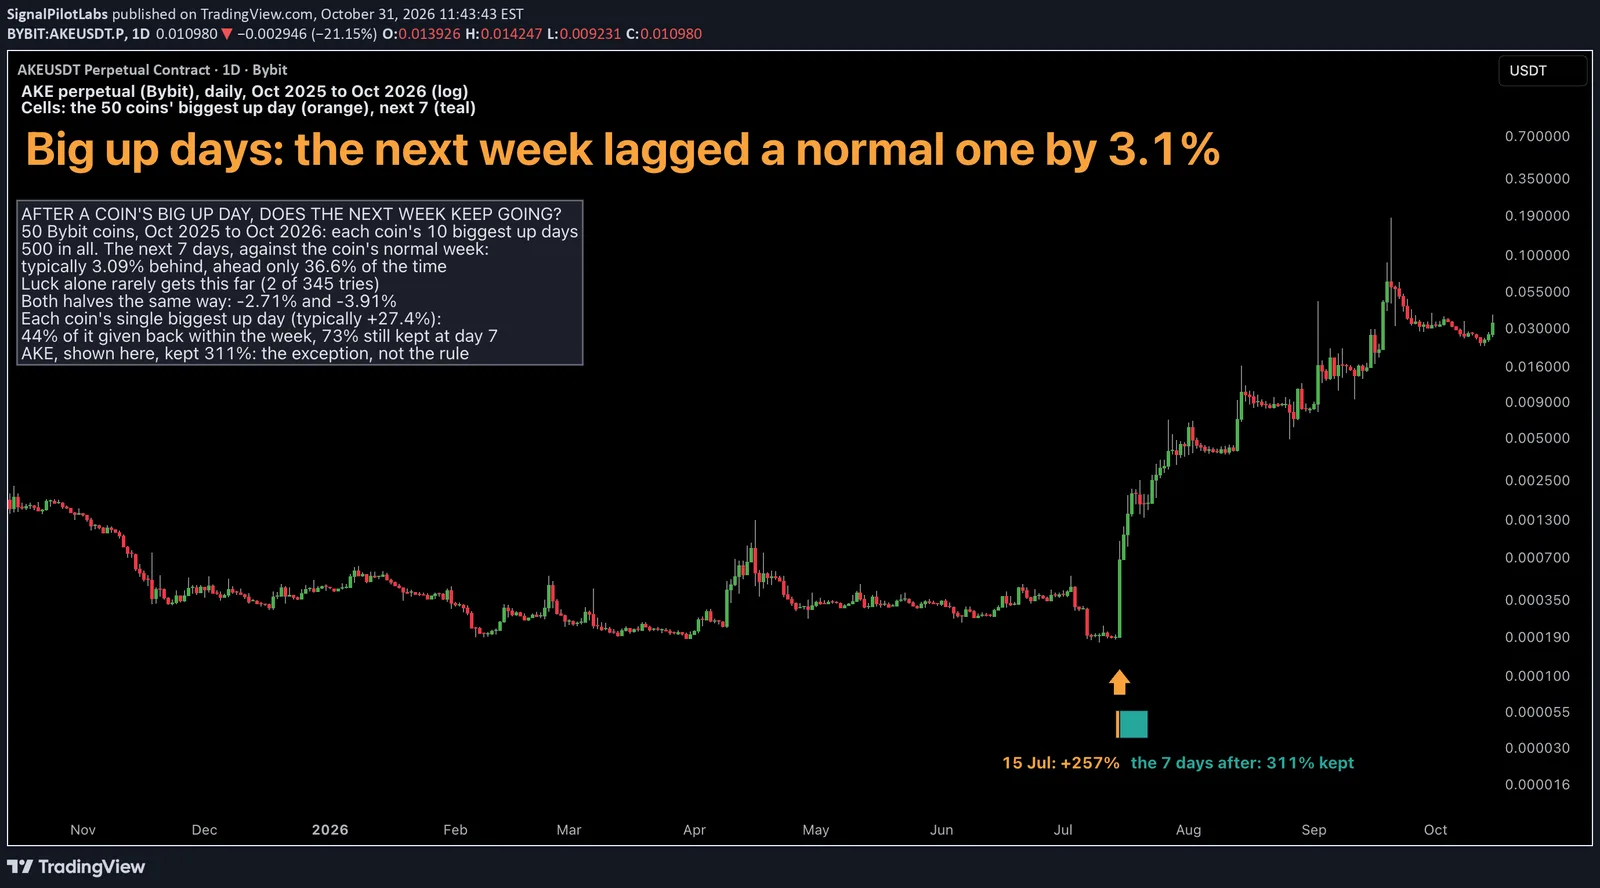
A coin has a huge green day. What happens in the week after? We followed the biggest up days of 50 Bybit coins over the year to 15 October 2026.
What we measured
Bybit daily closes for the 50 most traded perpetuals. For each coin, its 10 biggest up days of the year, each at least 7 days from a bigger one: 500 days in all. For each, the coin’s next 7 days against its own normal week over the year.
What we found
The week after a big up day ran 3.09% behind the coin’s normal week, as a median, and beat it only 36.6% of the time.
The single biggest day of each coin was a median +27.4%. Within the week, the median coin gave back 44% of it at its lowest close and still held 73% at day 7. Four gave back all of it and closed day 7 below where they started: SUI, BNB, XLM and XPL, whose +31.1% on 7 November 2025 ended the week 30% below the close before it.
Each coin’s biggest up day, how much of it was given back at the week’s lowest close, and how much was still kept 7 days later (below zero in the middle column: it never closed under that day’s close; above 100 on the right: it kept rising):
| Coin | Biggest up day (%) | Given back within the week (%) | Kept at day 7 (%) |
|---|---|---|---|
| AKE | +256.7 | -71 | 311 |
| BR | +159.9 | -2 | 204 |
| LSK | +140.3 | 96 | 8 |
| MOVR | +101.5 | 86 | 51 |
| RLC | +99.8 | 13 | 156 |
| QNT | +89.3 | 41 | 75 |
| FIL | +78.2 | 93 | 7 |
| USELESS | +68.8 | -10 | 128 |
| VVV | +61.1 | -21 | 236 |
| SAND | +52.9 | 10 | 99 |
| STRK | +52.7 | 39 | 80 |
| DASH | +48.8 | -58 | 158 |
| UNI | +42.2 | 85 | 31 |
| WLD | +41.5 | 80 | 43 |
| ARB | +34.4 | 83 | 19 |
| DOT | +34.3 | 36 | 71 |
| NEAR | +32.1 | 62 | 38 |
| TRUMP | +31.6 | 55 | 45 |
| TIA | +31.2 | 82 | 18 |
| XPL | +31.1 | 130 | -30 |
| BCH | +29.3 | 62 | 38 |
| ZEC | +29.1 | -20 | 140 |
| 1000PEPE | +28.4 | 47 | 53 |
| ONDO | +28.2 | 89 | 11 |
| PUMPFUN | +27.6 | -28 | 226 |
| HBAR | +27.3 | 78 | 22 |
| XLM | +27.3 | 104 | -1 |
| FARTCOIN | +26.2 | -30 | 164 |
| PENGU | +25.4 | 65 | 117 |
| ENA | +25.0 | -109 | 329 |
| SUI | +24.5 | 110 | -10 |
| TAO | +23.9 | 67 | 38 |
| AAVE | +23.7 | 2 | 98 |
| HYPE | +23.6 | 4 | 132 |
| AVAX | +23.0 | -6 | 140 |
| AERO | +22.3 | 38 | 63 |
| APT | +22.2 | 4 | 206 |
| INJ | +21.3 | 75 | 25 |
| XRP | +21.0 | 41 | 76 |
| OP | +19.4 | -6 | 232 |
| XMR | +18.7 | -13 | 113 |
| ZRO | +18.2 | -22 | 228 |
| ETH | +17.5 | -22 | 176 |
| LTC | +17.1 | 36 | 72 |
| ADA | +15.2 | 86 | 14 |
| DOGE | +14.9 | 88 | 12 |
| LINK | +13.1 | 55 | 107 |
| BTC | +12.2 | 56 | 78 |
| BNB | +11.8 | 194 | -91 |
| SOL | +11.6 | 99 | 66 |
Is it luck?
Big days bunch on the same dates across coins, so we shifted every coin’s dates together, 345 different ways. Only 2 of the shifts came out as far from zero as the real result. Both halves of the year agree: -2.71% and -3.91%.
What to do with it
After a coin’s big up day, the following week has tended to be weaker than usual, so a chase bought on the day itself has started from a worse place on this data. Our post on the longest losing streaks looked at the other side of the picture: the longest runs of red days, 11 in a row for AKE, STRK and ADA.
On the chart
AKE, the biggest single up day of the 50: +257% on 15 July 2026, daily, on a log scale. It is the exception: it never closed below that day’s close in the following week and kept 311% of the gain. The 500 big days did the opposite on average.
How to check your coin’s big days
- Take a year of your coin’s daily closes and find its 10 biggest up days, at least 7 days apart.
- Measure the 7 days after each one, and the coin’s normal 7 days over the whole year.
- Shift the dates many times to see how often chance gives a gap as big.
What this does not tell you
What any coin does after its next big day. One year, one exchange. Past data.
Observations, not recommendations.
We’re Signal Pilot Labs. We build the Elite Seven, seven indicators for TradingView, and we post what we measure, including the parts that didn’t work.
See what we build at signalpilot.io.
Published as a TradingView Idea on AKEUSDT. View the chart on TradingView
Past measurement described after the fact. Nothing here is a recommendation or an indication of future results.