Published as a TradingView Idea on BTCUSDT. View the chart on TradingView
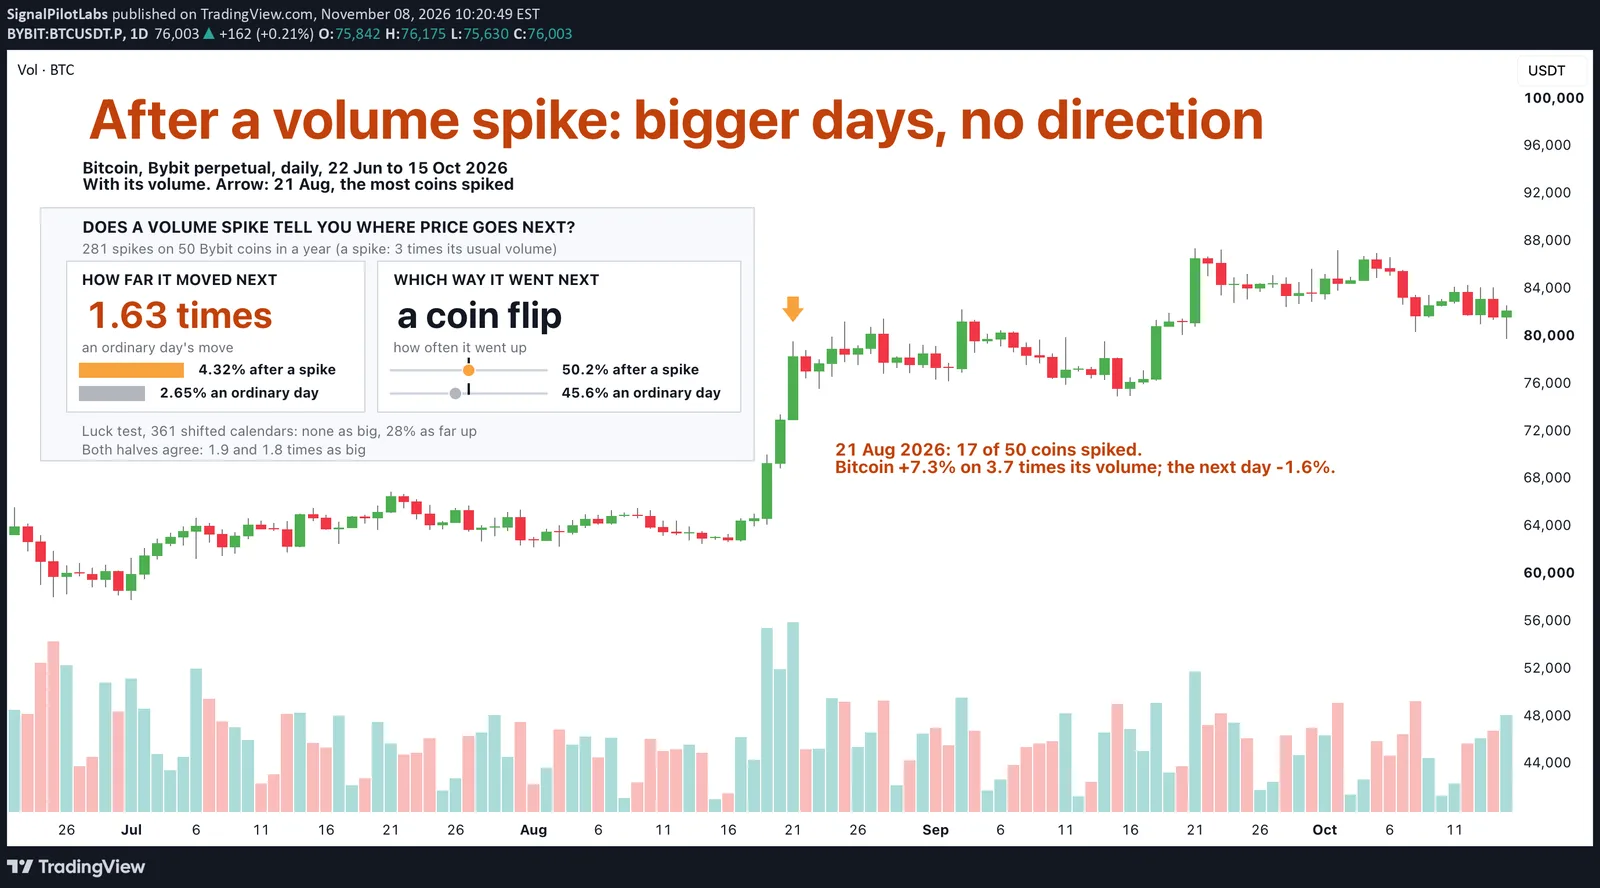
Does a day of 3 times the normal volume tell you where a coin goes next? We took every such day on 50 Bybit coins over the year to 15 October 2026 and looked at the day after. It moved about 1.6 times as much as an ordinary day; which way it went was a coin flip.
What we measured
Bybit daily volume, in dollars, for the 50 most traded perpetuals. A spike is a day with at least 3 times the coin’s median volume of the 30 days before (the median is the middle value of those 30 days). We counted a spike only when the coin had none in the 7 days before it, so one event counts once: 281 spikes. The day after is set against the coin’s ordinary day over the year.
What we found
Most spike days went up: 226 of 281, 80%. Big volume came with buying more often than with selling.
The day after was bigger, not better. It moved 4.32% at the median, either way, against 2.65% on an ordinary day: 1.63 times as much. It went up 50.2% of the time, against 45.6% on an ordinary day. After an up spike and after a down spike, the picture was the same.
| Coin | Spike days | Counted, 7 days apart | Up the day after |
|---|---|---|---|
| BR | 86 | 16 | 8 |
| RLC | 37 | 15 | 7 |
| AKE | 73 | 14 | 7 |
| AERO | 26 | 11 | 3 |
| MOVR | 74 | 11 | 5 |
| LSK | 53 | 10 | 2 |
| UNI | 23 | 9 | 3 |
| QNT | 40 | 8 | 5 |
| TIA | 19 | 8 | 1 |
| TRUMP | 45 | 8 | 4 |
| USELESS | 32 | 8 | 7 |
| ZRO | 45 | 7 | 4 |
| DASH | 50 | 6 | 5 |
| FIL | 26 | 6 | 4 |
| NEAR | 33 | 6 | 2 |
| STRK | 37 | 6 | 3 |
| TAO | 24 | 6 | 2 |
| VVV | 56 | 6 | 5 |
| WLD | 29 | 6 | 3 |
| XMR | 21 | 6 | 3 |
| ZEC | 27 | 6 | 4 |
| 1000PEPE | 16 | 5 | 3 |
| AAVE | 14 | 5 | 3 |
| HBAR | 13 | 5 | 3 |
| INJ | 23 | 5 | 2 |
| LTC | 12 | 5 | 2 |
| ONDO | 25 | 5 | 2 |
| PUMPFUN | 13 | 5 | 2 |
| SAND | 28 | 5 | 2 |
| XLM | 21 | 5 | 4 |
| ARB | 19 | 4 | 3 |
| BCH | 10 | 4 | 1 |
| BNB | 11 | 4 | 1 |
| DOT | 11 | 4 | 3 |
| SUI | 10 | 4 | 0 |
| XPL | 16 | 4 | 2 |
| APT | 6 | 3 | 0 |
| DOGE | 7 | 3 | 3 |
| FARTCOIN | 8 | 3 | 1 |
| HYPE | 30 | 3 | 3 |
| OP | 5 | 3 | 2 |
| PENGU | 14 | 3 | 2 |
| XRP | 13 | 3 | 2 |
| ADA | 4 | 2 | 0 |
| AVAX | 8 | 2 | 1 |
| ENA | 12 | 2 | 2 |
| ETH | 3 | 2 | 2 |
| LINK | 4 | 2 | 1 |
| BTC | 2 | 1 | 1 |
| SOL | 6 | 1 | 1 |
Is it luck?
Spikes bunch: on 21 August 2026, 17 of the 50 coins spiked on the same day. So we shifted every spike date by the same number of days, 361 shifts, which keeps the bunching. None of them gave a size ratio as large. On direction, 28% of the shifts came out as far from an ordinary day: no edge. Split into two halves, the year agrees on size: the day after moved 1.89 times an ordinary day from October to April, 1.77 times from April to October.
After a volume spike
Plan for a bigger day, not a side. A stop or a size set for an ordinary day meets a day that moves about 1.6 times as much. Our post on crypto’s biggest up days looked at the week after instead.
On the chart
Bitcoin, daily, 22 June to 15 October 2026, with its volume. The arrow marks 21 August 2026, the day the most coins spiked. Bitcoin rose 7.3% that day on 3.7 times its normal volume, and fell 1.6% the next.
We planned 60 days after the date; we drew the chart before they had passed, so it ends on 15 October 2026. Under the headline, two tiles split the answer: how far the next day moved, and which way it went.
How to check your coin’s volume spikes
- Take daily volume and mark each day with at least 3 times the median of the 30 days before it.
- Keep one per event, then note the next day’s direction and size.
- Compare them with an ordinary day, and shift the dates to see how often chance does as well.
What this does not tell you
Which way the next day will go. One year, one exchange. Past data.
Observations, not recommendations.
We’re Signal Pilot Labs. We build the Elite Seven, seven indicators for TradingView, and we post what we measure, including the parts that didn’t work.
See what we build at signalpilot.io.
Published as a TradingView Idea on BTCUSDT. View the chart on TradingView
Past measurement described after the fact. Nothing here is a recommendation or an indication of future results.