Published as a TradingView Idea on TRUMPUSDT. View the chart on TradingView
Volume Oracle has a trade plan built in. When it prints a BULL or BEAR signal, the signal candle’s close is the entry and the stop goes 1.5 ATR away. Once a candle closes 1 ATR in profit, the stop moves to the entry. That moment has its own alert, Breakeven.
A move that’s 1 ATR in your favour looks like it’s getting going. We measured what it did next.
The plan, step by step
- Entry: the close of the candle that printed BULL or BEAR.
- Stop: 1.5 ATR from the entry, on the other side. ATR is the 14 bar ATR.
- Breakeven: once a candle closes 1 ATR in profit, the stop moves to the entry. From then on, a close back past the entry ends the trade flat.
- Target 1: 2 ATR from the entry. Half the position comes off there, and the stop trails 1 ATR behind price after it.
- Target 2: 3.5 ATR from the entry.
Those are the script’s default settings. The T1 and BE labels on the chart are off by default.
What we measured
Every Breakeven on the 4 hour chart across 72 Bybit perpetual futures, April 2025 to September 2026: 525 of them. For each one: some candles later, was the coin further along in the trade’s direction than at the Breakeven close? And how often were other coins on the same candle, with a similar run-up, further along the same way?
What followed
Two days later, 12 candles, the coin had kept going the trade’s way 38.9% of the time. Other coins on the same candle: 46.0%.
| Candles after Breakeven | Kept going the trade’s way (%) | Other coins, same candle (%) |
|---|---|---|
| 3 | 41.7 | 47.0 |
| 6 | 41.1 | 46.0 |
| 12 | 38.9 | 46.0 |
Once a Volume Oracle trade was 1 ATR in profit, the move kept going less often than the market around it, at all three horizons. On crypto alone, 511 of the 525, it was 38.6% against 46.1%.
In 234 of the 525, a 4 hour candle closed back past the entry within two days. That’s the close the moved stop is there for: the trade ends flat there. In 61 of those 234, Target 1 had been hit first.
On the chart
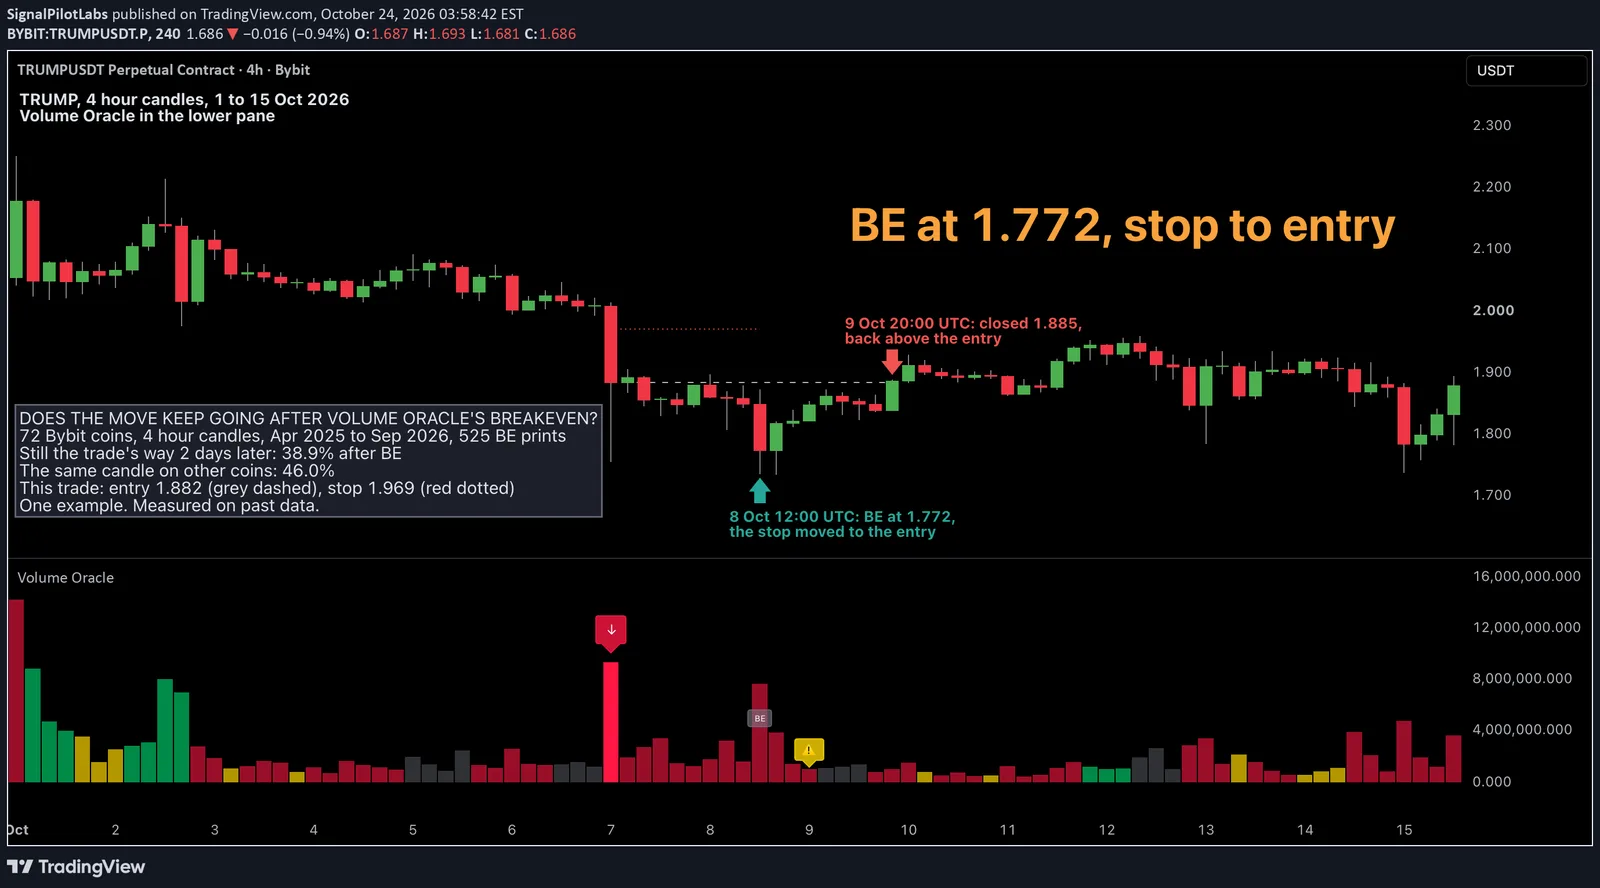
TRUMP, 4 hour, 1 to 15 October 2026. On the 00:00 UTC candle of 7 October, the candle of that morning’s long squeeze, TRUMP fell from 2.007 to 1.753 and closed at 1.882. Volume Oracle printed a BEAR signal on it: entry 1.882, stop 1.969.
On the 12:00 UTC candle of 8 October TRUMP closed at 1.772, more than 1 ATR in profit, and Volume Oracle printed BE: the stop moved to 1.882.
The move didn’t continue. Volume Oracle’s Exit Warning came on the next day’s 00:00 UTC candle, with a close of 1.847. At 20:00 UTC on 9 October TRUMP closed at 1.885, back above the entry, and two days after the Breakeven it was 6.7% above the Breakeven close.
It’s one example, picked by a rule we wrote before looking: the most recent Breakeven, as of 14 October when we wrote this, on a crypto coin whose trade later closed back past its entry. The numbers above cover all 525.
In the lower pane the bars are volume, coloured by Volume Oracle’s regime. The arrow is the BEAR signal, BE is the Breakeven and the warning sign is the Exit Warning. The same squeeze is the example in our post on Pentarch’s bearish momentum thrust, read through a different indicator.
How to do it
- In Volume Oracle’s settings, turn on “T1/BE labels”. They’re off by default. You can also set an alert on Breakeven.
- When BE prints, the plan’s stop is at the entry price. A close back past the entry ends the trade flat.
- Don’t read BE as the move speeding up. In our data, after BE the coin kept going less often than other coins on the same candle.
- Watch the closes against the entry line. On TRUMP the close back above it came 8 candles later.
How we checked it wasn’t noise
The test was written down before it ran. Each Breakeven was compared with coins that had made a similar move on the same candle, then with coins also matched on volume. We flipped the direction of each candle’s result at random 2,000 times, and none of the 2,000 produced a gap this size. It pointed the same way in both halves of the 18 months: 7.6 and 6.7 points below the other coins. Since the study ended, 9 more Breakevens have had two days to play out: 3 kept going, against 58% for other coins on the same candles. That’s too few to grade, and it points the same way.
What this does not tell you
This isn’t a trade. The share is about where price was two days later, not about profit, and it leaves out fees. It’s one timeframe on one exchange, mostly crypto (14 of the 525 were stock or commodity contracts), measured on data we already had. Comparing with same-candle coins removes the market’s move, not everything those coins had in common.
Observations, not recommendations.
We’re Signal Pilot Labs. We build the Elite Seven, seven indicators for TradingView, and we post what we measure, including the parts that didn’t work.
See what we build at signalpilot.io.
Published as a TradingView Idea on TRUMPUSDT. View the chart on TradingView
Past measurement described after the fact. Nothing here is a recommendation or an indication of future results.