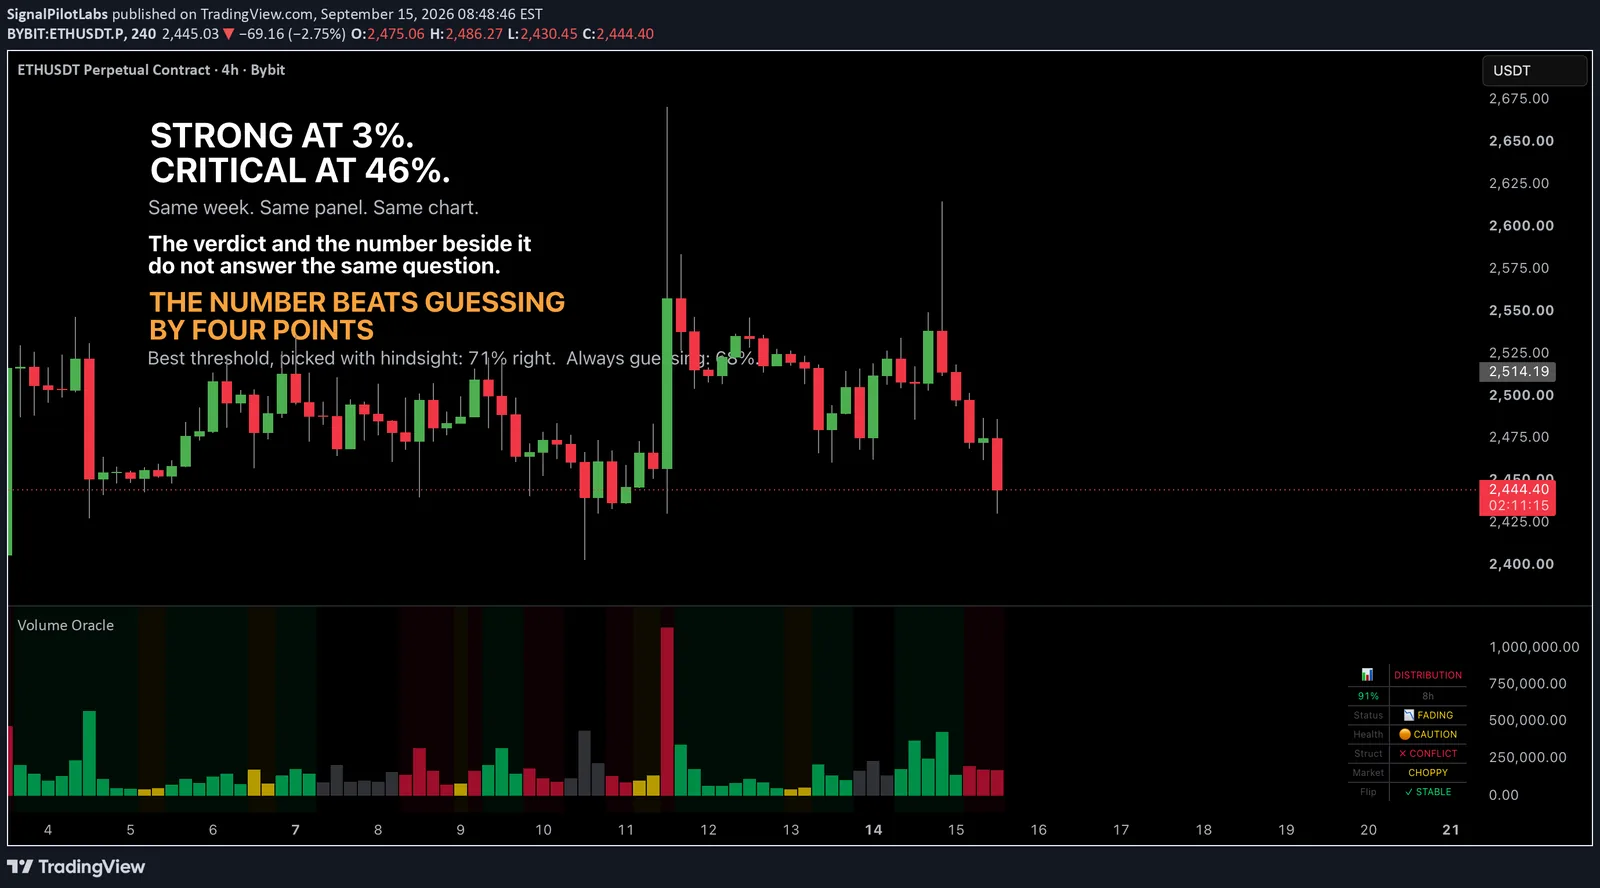
Published as a TradingView Idea on ETHUSDT. View the chart on TradingView
Open almost any indicator panel and you will find a verdict and a number sitting next to each other. A regime and a strength. A bias and a confidence score. A trend state and a percentage.
The layout invites one reading: the word summarises, the number quantifies. Same claim, two resolutions.
This is a week where that reading was wrong, on our own tool, and the check that shows it takes about twenty minutes on any chart you own.
What was read
Forty-one consecutive 4H bars on ETHUSDT.P, 7 to 13 September 2026. For each bar we wrote down three things straight off the Volume Oracle table in replay: the regime, the status, and the strength percentage.
Nothing was modelled and nothing was fetched from an API. The panel is the thing under test, so the panel is what was read.
Nine bars were NEUTRAL, where the ladder does not run. That leaves 32 bars carrying both a verdict and a number.
The overlap
| status | bars | strength range | median |
|---|---|---|---|
| ✓ STRONG | 19 | 3% to 100% | 77% |
| 📉 FADING | 3 | 68% to 75% | 72% |
| ⚡ WEAKENING | 1 | 50% | 50% |
| ⚠ CRITICAL | 9 | 6% to 46% | 33% |
The medians separate cleanly, which is what makes this easy to miss. The distributions do not.
Seven of the nineteen STRONG bars, thirty-seven percent of them, printed a strength below the median CRITICAL bar. They read 3, 4, 8, 10, 23, 25 and 31 percent.
The reverse did not happen once. Zero of nine CRITICAL bars printed above the median STRONG bar.
The failure is one-directional. CRITICAL stays in its lane; STRONG appears anywhere.
The pair that makes the point
| bar | verdict | number |
|---|---|---|
| 13 September, 16:00 | ✓ STRONG | 3% |
| 12 September, 16:00 | ⚠ CRITICAL | 46% |
Same week, same chart, same panel. Forty-three points in the wrong direction.
The test that settles it
Whether two columns correlate is the weak question, and a correlation can be a long way from zero while being useless.
The question that decides whether a column earns its space is this: can the number tell you the verdict?
Take the 28 bars reading STRONG or CRITICAL. Find the single threshold that separates them best, and let it cheat, picking the most flattering cut point with full hindsight on this exact data.
| rule | bars called right | accuracy |
|---|---|---|
| always guess the commoner label | 19 of 28 | 67.9% |
| best possible threshold, at 41% | 20 of 28 | 71.4% |
| what the number buys | one more bar | 3.6 points |
A threshold fitted with hindsight, on its own data, chosen to flatter itself, calls exactly one more bar correctly than a constant guess does.
That is not a weak signal. On this window, it is not a signal.
The clearest single frame
Two consecutive bars on 10 September:
| bar | verdict | number |
|---|---|---|
| 00:00 | 📉 FADING | 72% |
| 04:00 | ✓ STRONG | 10% |
The verdict moved up a rung while the number fell sixty-two points.
And the ladder does not descend, it blinks
While we were reading, a second thing showed up. CRITICAL fired seven times that week:
| entered | bars | what came next |
|---|---|---|
| 7 September, 04:00 | 1 | NEUTRAL, the regime did flip |
| 9 September, 00:00 | 1 | ✓ STRONG at 77% |
| 11 September, 04:00 | 2 | ✓ STRONG at 100% |
| 11 September, 20:00 | 1 | ✓ STRONG |
| 12 September, 04:00 | 1 | ✓ STRONG at 100% |
| 12 September, 16:00 | 2 | 📉 FADING |
| 13 September, 04:00 | 1 | ✓ STRONG |
Median episode: one bar. Longest: two. And it resolved back up the ladder six times out of seven.
The 9 September case is the one worth sitting with. Status CRITICAL, health reading DANGER, a regime flip counting down. Four hours later, STRONG at 77%.
What this is not
Not a claim that the indicator is broken. The status is evidently computed from inputs other than the displayed percentage, and it is entitled to be.
The finding is about the display. Two figures printed side by side, read as one claim, answering different questions, with nothing in the panel telling a reader which is which.
Nor does it generalise. One symbol, one timeframe, one week, 41 bars, read by hand. It is descriptive of that window.
What we did about it
The ladder came off our own board line some time ago. Only CRITICAL survived, and it is printed with the measurement that earned it beside it, so nobody reads the word without the evidence behind it.
This post is the public version of a decision already taken on the evidence.
Run it yourself
Pick any indicator that prints a state and a number together. Write down both for thirty bars. Then ask your notes one question:
Did the number ever tell you the state before you read it?
If not, you have two columns and one of them is decoration.
Published as a TradingView Idea on ETHUSDT. View the chart on TradingView
Past measurement of our own tooling, described after the fact. Nothing here is a recommendation or an indication of future results.