Published as a TradingView Idea on SPX. View the chart on TradingView
Gold is the old safe haven, and Bitcoin is often called digital gold. The days stocks fall hardest are when a haven should show itself. We checked both on the S&P 500’s worst days since 2015.
What we measured
TradingView daily closes of the S&P 500, gold (OANDA’s XAU/USD) and Bitcoin (Bitstamp), from January 2015 to 14 October 2026. A worst day is an S&P 500 close 2% or more below the day before: 98 of them. On each, did gold rise that day, and did Bitcoin? To test luck, we drew 10,000 random sets of 98 days, and we set the bar before running anything.
What we found
| Market | Rose on the worst days (%) | Rose on other days (%) | Typical move on the worst days (%) | Random sets as far, of 10,000 |
|---|---|---|---|---|
| Bitcoin | 31.6 | 52.3 | -1.97 | 0 |
| Gold | 52.0 | 52.7 | +0.07 | 9,160 |
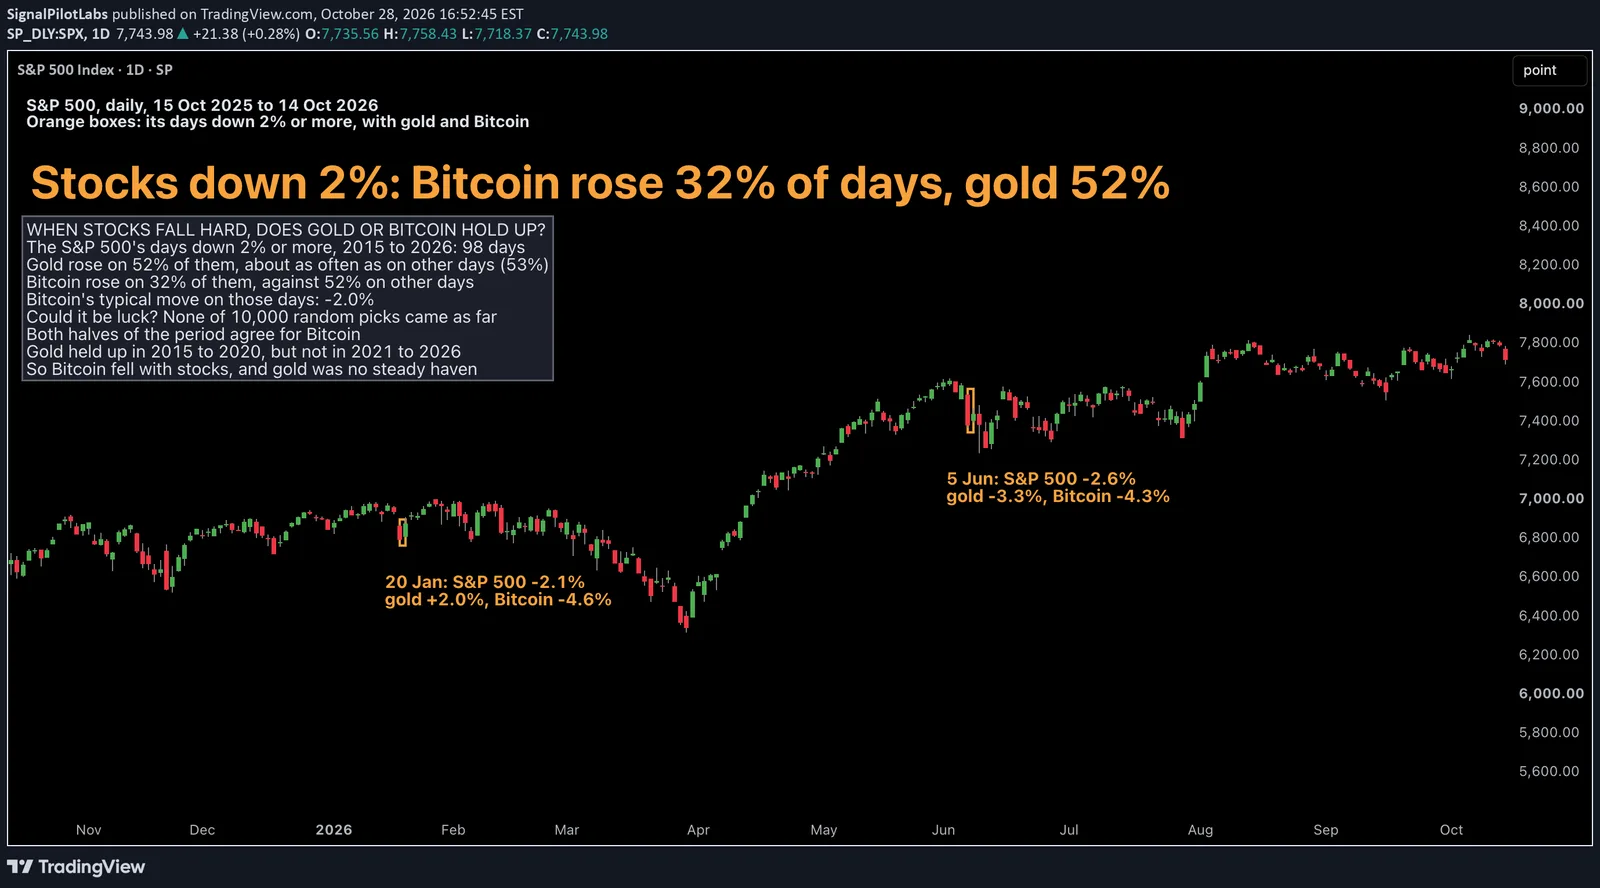
Bitcoin rose on 31.6% of the S&P 500’s worst days, against 52.3% of the other days, with a typical move of -1.97%. None of the 10,000 random sets came as far, and both halves of the period agree, the second more strongly. By our bar, Bitcoin fell with stocks.
Gold rose on 52.0% of the worst days, about as often as on other days. It held up from 2015 to 2020, rising more often than usual on those days, but not from 2021 to 2026, when it rose less often. Over the whole period, no pattern.
On the chart
The S&P 500 over the last 12 months, with its two days down 2% or more boxed. On 20 January the S&P lost 2.1%, gold gained 2.0% and Bitcoin lost 4.6%. On 5 June the S&P lost 2.6%, gold 3.3% and Bitcoin 4.3%.
How to check it yourself
- List the days the S&P 500 closed 2% or more below the day before.
- For each, note whether gold and Bitcoin closed higher that day.
- Compare those shares with how often each closed higher on all the other days.
What this does not tell you
What either does over the days after, or through a long bear market. Bitcoin’s daily close comes a few hours after the US close. Past data.
Observations, not recommendations.
We’re Signal Pilot Labs. We build the Elite Seven, seven indicators for TradingView, and we post what we measure, including the parts that didn’t work.
See what we build at signalpilot.io.
Published as a TradingView Idea on SPX. View the chart on TradingView
Past measurement described after the fact. Nothing here is a recommendation or an indication of future results.