Published as a TradingView Idea on SPX. View the chart on TradingView
US consumer prices rose 0.66% in September, a hot month by the line we use here, 0.4% or more. Is hot inflation bad for stocks? We checked every month since 1970.
What we measured
US consumer prices month by month (the CPI for all urban consumers, seasonally adjusted, FRED:CPIAUCSL) and the S&P 500’s monthly closes (SP:SPX), from April 1970 to September 2026: 676 months. A hot month is one in which prices rose 0.4% or more: 214 of them. For each we asked whether the S&P 500 fell that month, and the month after, when the hot number came out, against all the other months. Both tests, and the bar they had to clear, were written down before any S&P 500 month was set beside its CPI month. October and November 2025 are left out: October 2025’s CPI was never published, during the government shutdown.
What we found
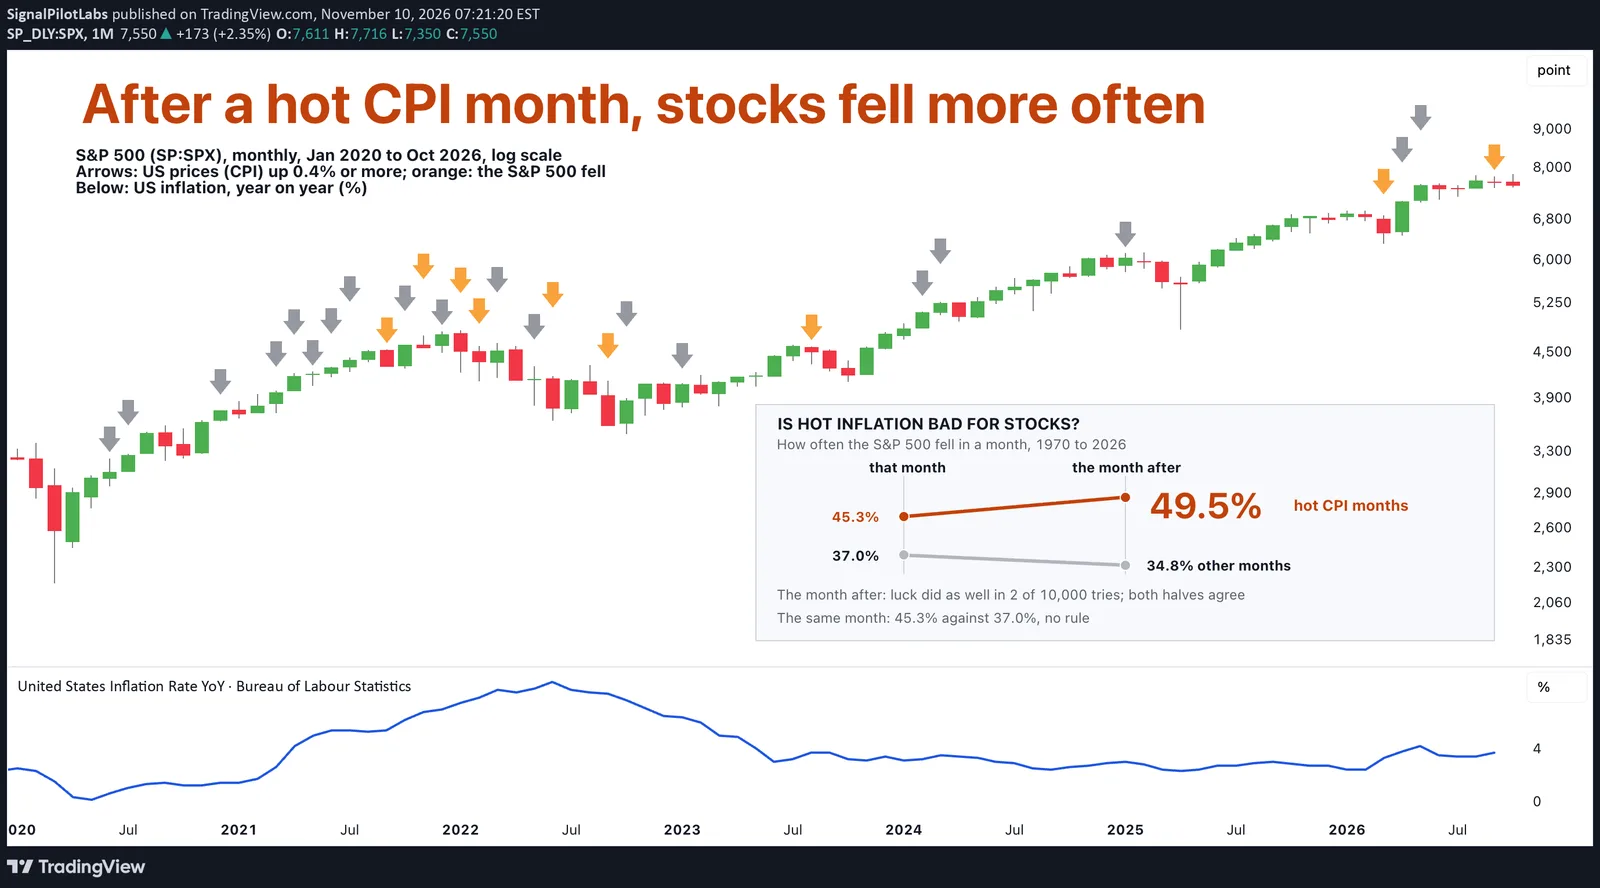
In the month after a hot month, the S&P 500 fell 49.5% of the time (106 of 214). In the month after the other months it fell 34.8%. The typical month after a hot one was flat, +0.01%, against +1.30% after the others.
In the hot month itself it fell 45.3% of the time, against 37.0%, but that one did not hold: since 1998 it went the other way, 29.6% against 40.1%. The typical hot month: +0.51%, against +1.17%.
| Test | Hot months, S&P 500 down (%) | Other months (%) | Luck did as well (of 10,000) |
|---|---|---|---|
| The month after a hot month | 49.5 (106 of 214) | 34.8 | 2 |
| The hot month itself | 45.3 (97 of 214) | 37.0 | 269 |
Could it be luck?
We drew 214 months at random, 10,000 times: only 2 draws held 106 falls or more in the month after. And it held in both halves: 51.0% against 33.7% from 1970 to 1997, and 46.5% against 35.7% from 1998 to 2026. That meets the bar we set first: in this record, the month after a hot CPI month fell more often.
The months
The hottest month in the record, August 1973 (+1.81%): the S&P 500 fell 3.67% that month and rose 4.01% the next. August 2026’s +0.39% sat just under the line. The record ends with September 2026’s CPI and October’s S&P 500 month: October’s CPI came out after it and is not part of the test.
| Month | US CPI (%) | S&P 500 that month (%) | S&P 500 the month after (%) |
|---|---|---|---|
| January 2025 | +0.44 | +2.70 | -1.42 |
| March 2026 | +0.85 | -5.09 | +10.42 |
| April 2026 | +0.64 | +10.42 | +5.15 |
| May 2026 | +0.48 | +5.15 | -1.06 |
| September 2026 | +0.66 | -0.45 | -0.93 |
On the chart
The S&P 500 monthly on a log scale (equal steps up the scale are equal percentage moves), January 2020 to October 2026. An arrow marks each hot CPI month, orange when the S&P 500 fell that month and grey when it rose: 9 of the 28 are orange. What held is the month after, the next candle. Below, the blue line is US inflation year on year, and the run of hot months in 2021 and 2022 is where it climbs highest.
What to do with it
When a CPI print comes in at 0.4% or more, the record says the S&P 500’s next month has been down about half the time, against about a third after other months. It does not say how far, and a down month is not a crash. Our post on the PPI and CPI hours gives how much US stock futures move in the hour a print comes out.
How to check it yourself
- Take US CPI month by month and the S&P 500’s monthly closes, and mark each month prices rose 0.4% or more.
- For each, see whether the S&P 500 closed the next month lower, and do the same after every other month.
- Compare the shares, then in each half of the record, and see how often random months do as well.
What this does not tell you
What the market expected (a hot print can still beat the forecast), the day of the release, rates, or other markets. Monthly closes, past data.
Observations, not recommendations.
We’re Signal Pilot Labs. We build the Elite Seven, seven indicators for TradingView, and we post what we measure, including the parts that didn’t work.
See what we build at signalpilot.io.
Published as a TradingView Idea on SPX. View the chart on TradingView
Past measurement described after the fact. Nothing here is a recommendation or an indication of future results.