Published as a TradingView Idea on XAGUSD. View the chart on TradingView
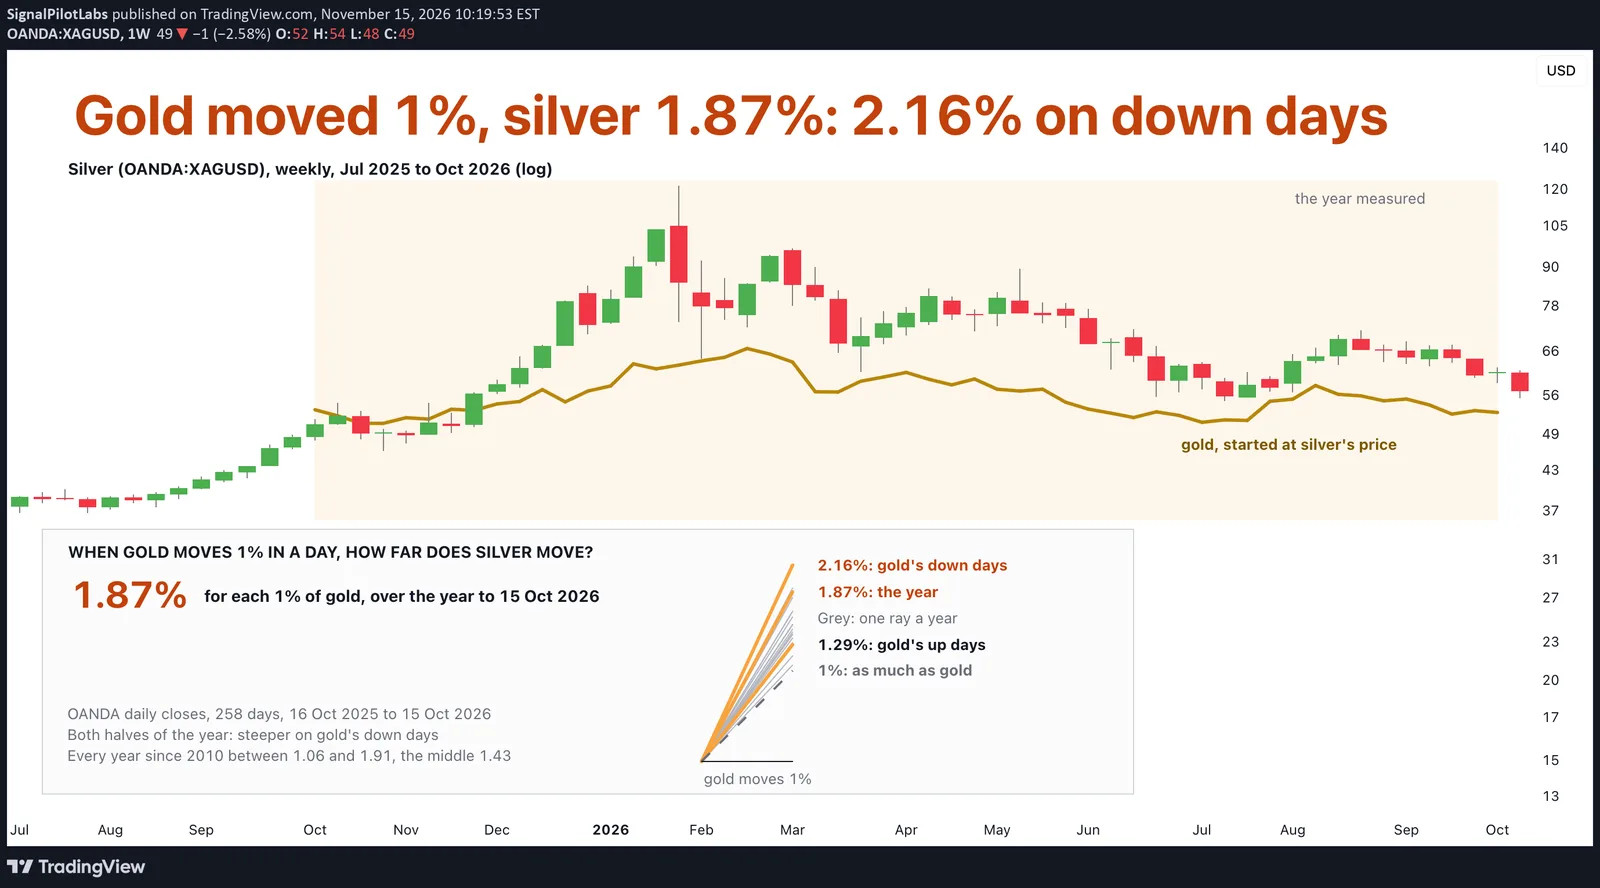
When gold moves 1% in a day, how far does silver move? Over the year we measured, 1.87%, and more on gold’s down days than on its up days. That number is silver’s beta to gold, measured over that year and for every calendar year since 2010.
What we measured
TradingView daily closes for gold (OANDA:XAUUSD) and silver (OANDA:XAGUSD), matched day by day: 258 trading days from 16 October 2025 to 15 October 2026. Silver’s beta is the slope of its daily moves against gold’s: a beta of 2 means silver moved 2% for each 1% of gold, on the straight line through the days. We also took the same slope on gold’s down days and on its up days, and the beta for each calendar year from 2010 to 2026.
What we found
Over the year, silver’s beta was 1.87: it moved 1.87% for each 1% of gold. The correlation, the measure of how closely the two moved together (1 is lockstep), was 0.83.
On gold’s down days the slope was 2.16; on its up days, 1.29. Split in halves, the year leaned the same way in both: 2.29 against 1.19 in its first half, 1.79 against 1.28 in its second. We added the halves as a check after the first results.
Is that lean luck, or silver’s usual shape? Across the calendar years since 2010, the down-day slope was the bigger one in 8 of 17, about as often as a coin flip. So the lean belongs to this year, not to silver. We counted that after seeing the year’s numbers.
Year by year
Every year since 2010 had a beta above 1, and none above 2. The median year, the middle one when they are lined up, was 1.43. Its lowest was 2025, at 1.06, with a correlation of only 0.63. The highest is 2026 so far, at 1.91: the year silver spiked to 121.7 in late January and was back near 57 by mid-October. 2026 runs to 15 October.
| Year | Beta to gold | Correlation | On gold’s down days | On gold’s up days |
|---|---|---|---|---|
| 2010 | 1.50 | 0.81 | 1.63 | 1.34 |
| 2011 | 1.65 | 0.74 | 1.73 | 0.87 |
| 2012 | 1.51 | 0.84 | 1.40 | 1.41 |
| 2013 | 1.36 | 0.90 | 1.39 | 1.41 |
| 2014 | 1.27 | 0.82 | 1.26 | 1.42 |
| 2015 | 1.31 | 0.75 | 1.27 | 1.37 |
| 2016 | 1.16 | 0.74 | 1.25 | 0.87 |
| 2017 | 1.40 | 0.82 | 1.42 | 1.29 |
| 2018 | 1.40 | 0.83 | 1.54 | 1.12 |
| 2019 | 1.29 | 0.79 | 1.66 | 1.01 |
| 2020 | 1.80 | 0.79 | 1.82 | 1.85 |
| 2021 | 1.46 | 0.74 | 1.41 | 1.82 |
| 2022 | 1.59 | 0.81 | 1.51 | 1.75 |
| 2023 | 1.43 | 0.76 | 1.39 | 1.43 |
| 2024 | 1.65 | 0.80 | 1.54 | 1.92 |
| 2025 | 1.06 | 0.63 | 1.05 | 0.73 |
| 2026 | 1.91 | 0.85 | 2.33 | 1.43 |
A beta is about the days
It does not say how the year ends. Over the same year, close to close, gold ended 0.9% lower and silver 8.2% higher. The beta describes how the two moved together day by day, not the net change. Our post on a normal week in gold and silver gives the size of an ordinary week in each.
On the chart
Silver, weekly, July 2025 to October 2026, on a log scale, where equal steps on the price axis are equal percentage moves. The shaded weeks are the year measured. Gold’s line is its own path over those weeks, started at silver’s price on 15 October 2025, so the two can be compared: silver swung far wider. Each number in the box is drawn as a slope, and the steeper the line, the more silver moved for gold’s 1%.
How to work out silver’s beta yourself
- Take daily closes for gold and for silver, keep only the days both have, and turn each close into a daily move.
- Put the two columns of moves into a spreadsheet’s slope function, silver as the first column and gold as the second (SLOPE in Excel and Google Sheets).
- Check the correlation too, and work it out year by year. The number moves.
What this does not tell you
How silver will move next. A beta is an average slope over past days, the days scatter around it, and it went from 1.06 in 2025 to 1.91 in 2026. Past data.
Observations, not recommendations.
We’re Signal Pilot Labs. We build the Elite Seven, seven indicators for TradingView, and we post what we measure, including the parts that didn’t work.
See what we build at signalpilot.io.
Published as a TradingView Idea on XAGUSD. View the chart on TradingView
Past measurement described after the fact. Nothing here is a recommendation or an indication of future results.