Published as a TradingView Idea on SILVER. View the chart on TradingView
Silver traders argue both ways after a big day: chase a 5% jump, or buy a 5% drop. We checked every such day since 1978: was silver higher a month later more often than after any day?
What we measured
TradingView’s daily closes of spot silver (TVC:SILVER), from 3 January 1978 to 30 October 2026. A 5% day closed 5% or more above the day before (a jump) or below it (a drop): 191 jumps and 196 drops. Big days come in runs, so we counted only the first of each run, one with no counted big day the same way in the 20 trading days before: 88 jumps and 98 drops with a month to follow. A month later means 20 trading days, set against the 12,131 days of any kind with a month to follow. We wrote the rules and the bar down before counting a single day.
What we found
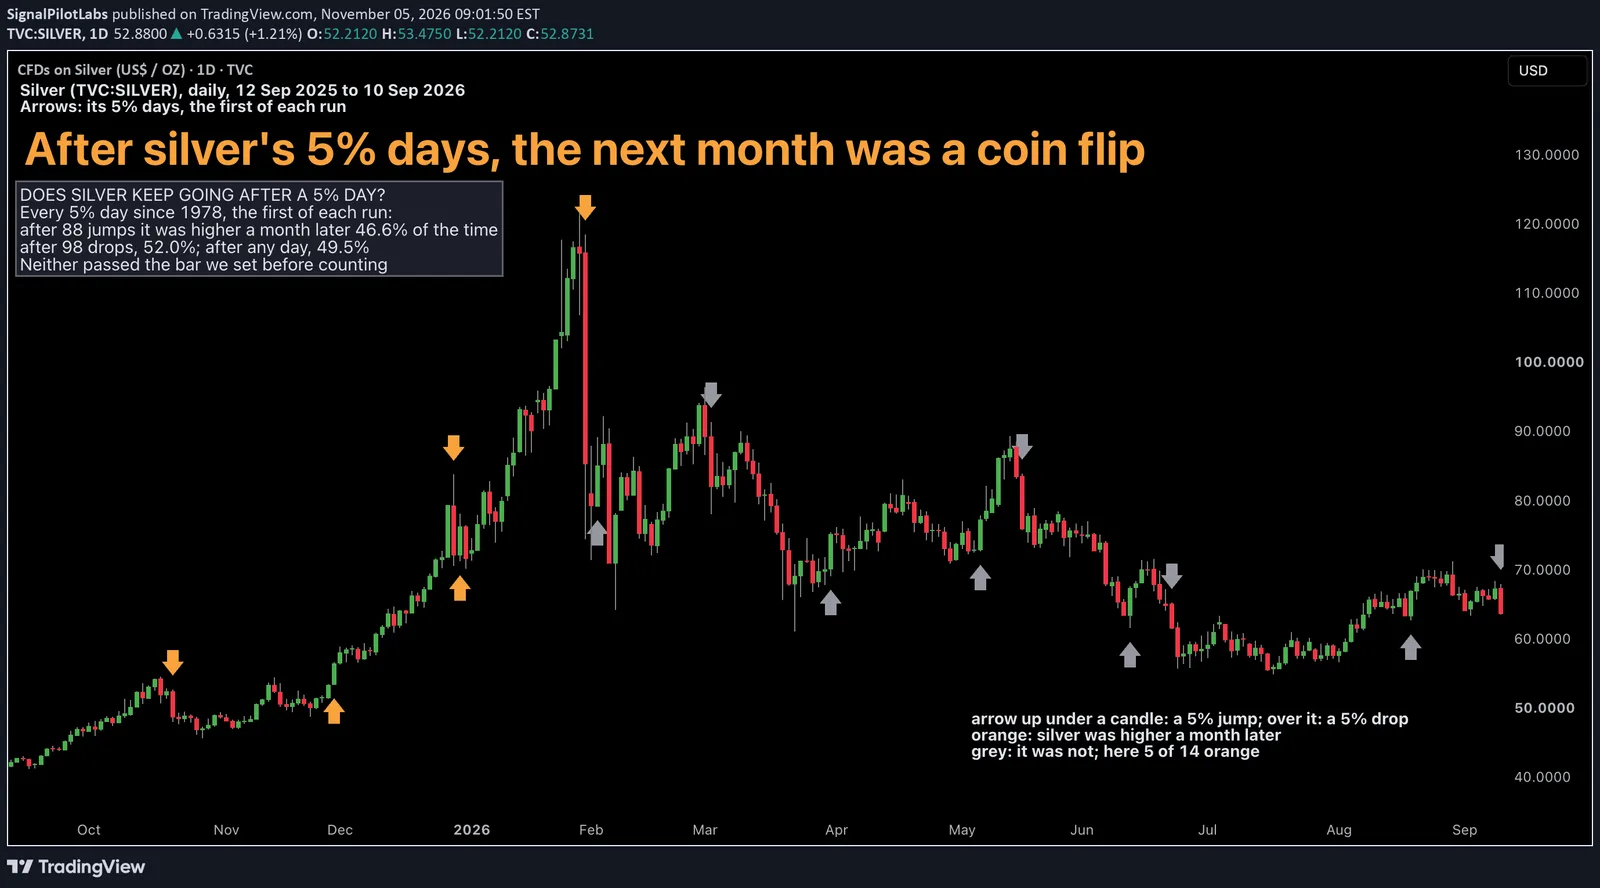
After the 88 jumps silver was higher a month later 46.6% of the time (41 of 88), against 49.5% after any day; the typical jump was followed by a 0.9% loss. After the 98 drops it was higher 52.0% of the time (51 of 98), with a typical 0.7% gain. In the week after a drop it rose only 42.9% of the time, against 51.1% after any day.
| Day | Counted | Higher a month later (%) | Typical change (%) |
|---|---|---|---|
| After a jump | 88 | 46.6 | -0.9 |
| After a drop | 98 | 52.0 | +0.7 |
| After any day | 12,131 | 49.5 | 0.0 |
Is it luck?
We drew as many ordinary days as there were jumps, and then drops, 10,000 times each: 7,407 draws did at least as well as the jumps and 3,381 as well as the drops. The drops were ahead in both halves of the record, 46.9% against 44.8% from 1978 to 2001 and 57.1% against 54.0% from 2002 to 2026, but a third of the draws did as well. Neither met the bar we set first.
| Years | Jumps, higher (%) | Drops, higher (%) | Any day, higher (%) |
|---|---|---|---|
| 1978 to 2001 | 43.2 | 46.9 | 44.8 |
| 2002 to 2026 | 50.0 | 57.1 | 54.0 |
The biggest days
Silver’s biggest jump, 34.8% on 2 January 1980, was 7.9% lower a month later. Its biggest drop, 30.8% on 27 March 1980, Silver Thursday, was 34.2% higher a month later.
On the chart
Silver daily over the 250 trading days ending at its last counted big day with a month to follow, 12 September 2025 to 10 September 2026: 7 jumps and 7 drops, orange when silver was higher a month later and grey when it was not. The 5 orange arrows all came on or before its 30 January drop; the 9 after it were all grey.
What to do with it
Read a 5% day in silver as noise for the month ahead, not as the start of a run or a bargain by itself. The weak week after a drop is in the record, but we did not test it. Our post on the S&P 500’s new highs counted the months it set a new record.
How to check it yourself
- Take silver’s daily closes and mark the days it closed 5% or more above or below the day before, keeping only the first of each run.
- For each, see whether silver was higher 20 trading days later, and do the same for every day.
- Compare the shares, in each half of the record.
What this does not tell you
What happens inside the day, silver futures or funds, how far silver moved in the month (only whether it was higher), or other metals. Daily closes, past data.
Observations, not recommendations.
We’re Signal Pilot Labs. We build the Elite Seven, seven indicators for TradingView, and we post what we measure, including the parts that didn’t work.
See what we build at signalpilot.io.
Published as a TradingView Idea on SILVER. View the chart on TradingView
Past measurement described after the fact. Nothing here is a recommendation or an indication of future results.