Published as a TradingView Idea on USDJPY. View the chart on TradingView
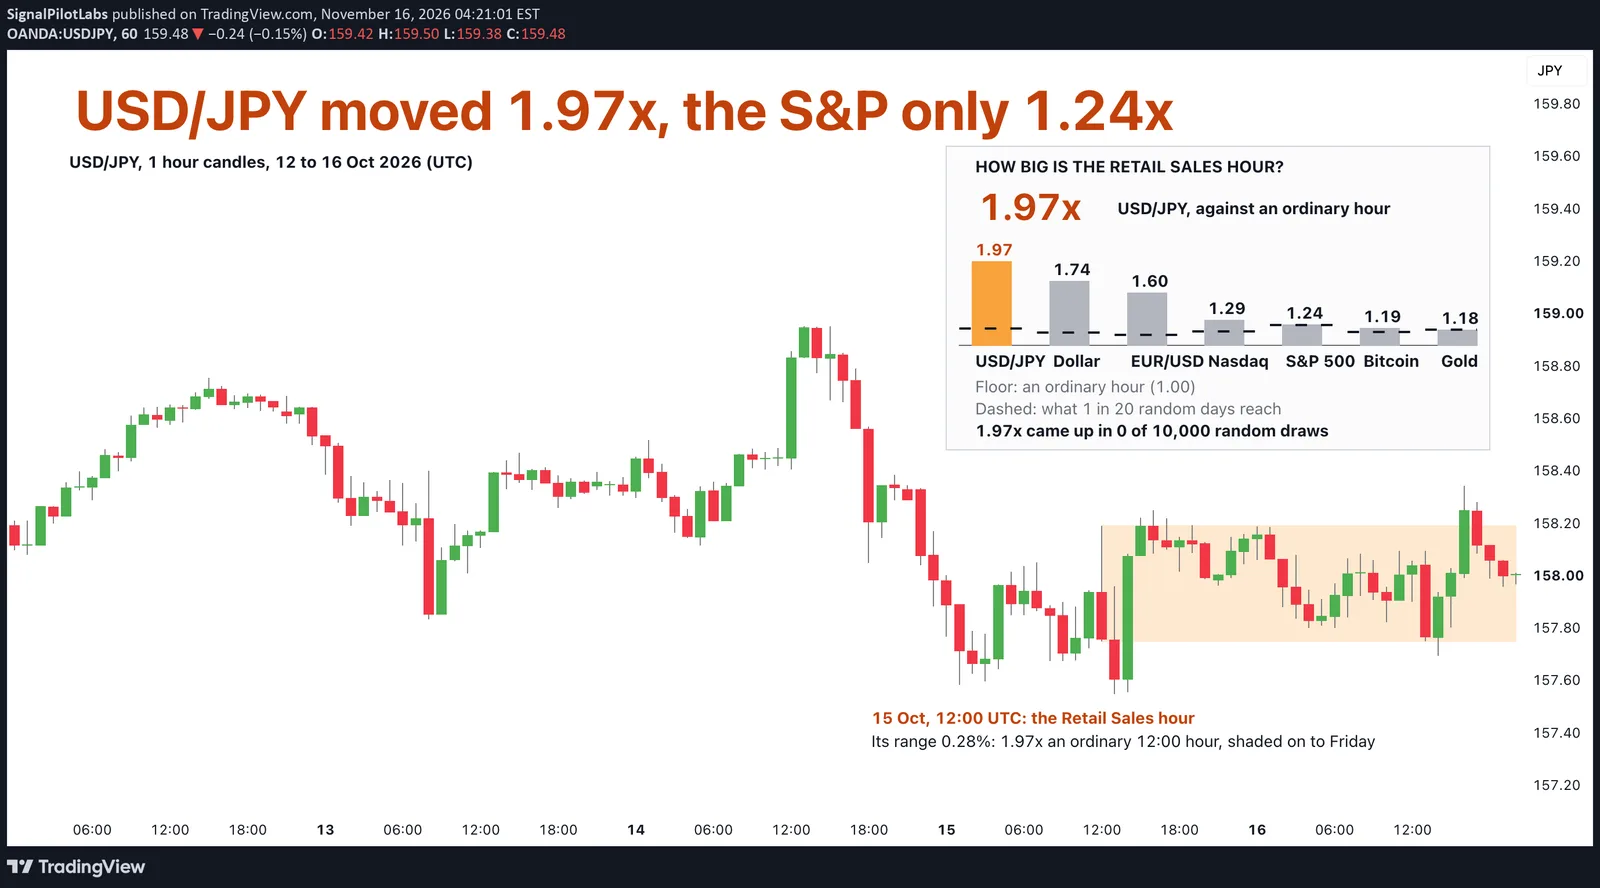
US retail sales print on Tuesday 17 November at 13:30 UTC, 08:30 in New York. Which market moves most in that hour? Not the US stock futures, which CPI and PPI move most. In past Retail Sales hours the dollar moved most: USD/JPY 1.97 times an ordinary hour, the S&P 500 futures 1.24.
How we measured it
For every Retail Sales release from 15 February 2024 to 15 October 2026, 33 of them, we took the 1 hour candle the release lands in and its range, high to low, in percent. Then we divided it by the median (the middle value) for the same New York hour on the 20 weekdays before it with no major release. So 1.00 means the Retail Sales hour looked like any other hour.
The markets are USD/JPY, the dollar index, EUR/USD, Nasdaq 100 and S&P 500 futures (the stock market itself is closed at 08:30 New York), Bitcoin and gold, all from TradingView’s 1 hour data. Our post on the PPI hour measured the same seven markets, and there the stock futures led.
What we found
| Market | Retail Sales hour (times an ordinary hour) | Above an ordinary hour (of 33) | Moved most of the seven (of 33) | Last 12 months (times) |
|---|---|---|---|---|
| USD/JPY | 1.97 | 30 | 13 | 1.30 |
| Dollar index | 1.74 | 28 | 4 | 1.44 |
| EUR/USD | 1.60 | 29 | 4 | 1.54 |
| Nasdaq 100 futures | 1.29 | 23 | 0 | 1.21 |
| S&P 500 futures | 1.24 | 25 | 5 | 1.15 |
| Bitcoin | 1.19 | 21 | 5 | 1.40 |
| Gold | 1.18 | 24 | 2 | 1.04 |
USD/JPY beat an ordinary hour on 30 of 33 Retail Sales hours, and it led the seven on 13 of them. The S&P 500 futures led on 5.
Ordinary days have big hours too, so we checked whether luck could do this. We drew 33 release-free weekdays at random, 10,000 times, and sized their same hour the same way. USD/JPY’s 1.97 came up in none of the 10,000 draws, and the largest draw was 1.50. The S&P 500 futures’ 1.24 came up in 476 of them, about 1 in 21. So the dollar’s hour sits far outside an ordinary day, and the stock futures’ hour sits near its edge.
Split the 33 releases in two halves and the order at the top holds. In the first 17, February 2024 to June 2025, USD/JPY came in at 2.14 and the S&P 500 futures at 1.30. In the last 16, July 2025 to October 2026, USD/JPY came in at 1.57 and the S&P 500 futures at 1.13. The gap narrowed, but the dollar stayed ahead.
For scale, CPI measured the same way moves USD/JPY 3.04 times and the S&P 500 futures 3.81 times. Retail Sales keeps about two thirds of CPI’s move in USD/JPY and about a third of it in the stock futures.
In the last 12 months, 13 releases, the order shifted. EUR/USD led at 1.54 and the dollar index followed at 1.44, then Bitcoin at 1.40 and USD/JPY at 1.30. The stock futures stayed near the bottom, the S&P 500 futures at 1.15, and gold was last at 1.04.
Shared hours
Nine of the 33 releases shared their hour with another one: PPI five times, payrolls twice, CPI once and the ECB once. Without them, 24 releases, the top three keep their order: USD/JPY 1.99, the dollar index 1.71, EUR/USD 1.56.
On the chart
USD/JPY, 1 hour, 12 to 16 October 2026. The most recent Retail Sales landed at 12:30 UTC on 15 October. It fell inside the 12:00 candle, which ranged 0.28%. That was 1.97 times an ordinary 12:00 candle, and the shading carries that hour’s high and low on to Friday. PPI printed the same minute, so that hour belongs to both, and EUR/USD had the biggest hour of the seven, 2.40 times.
The panel shows each market’s Retail Sales hour as a column over a floor at 1.00, an ordinary hour, with a dashed cap at the size 1 in 20 random draws reach. To check it yourself on TradingView, open USD/JPY on the 1 hour chart in UTC and take a Retail Sales candle’s range. Divide it by the middle range of the same hour on the 20 weekdays before it.
What this does not tell you
It does not tell you which way. It measures how far the hour moved, not the direction, and it doesn’t tell you to buy or sell. These are medians: half the Retail Sales hours moved less. With 33 releases the sample is small, the luck check and the halves were added after the first result, and the last 12 months show the lead can change.
What it’s good for is knowing what you’re holding into on Tuesday morning in New York.
Observations, not recommendations.
We’re Signal Pilot Labs. We build the Elite Seven, seven indicators for TradingView, and we post what we measure, including the parts that didn’t work.
See what we build at signalpilot.io.
Published as a TradingView Idea on USDJPY. View the chart on TradingView
Past measurement described after the fact. Nothing here is a recommendation or an indication of future results.