Published as a TradingView Idea on USOIL. View the chart on TradingView
Plutus Flow tracks OBV, volume added on up closes and taken away on down closes, against its own average, with a band two standard deviations either side. When OBV pushes outside a band, Plutus calls it a breach. The script’s notes call those zones the exhaustion legs. We measured what a breach tells you on WTI crude oil’s 4 hour chart, the first time we’ve measured one of the Elite Seven on a market that isn’t crypto.
What a breach is
Plutus draws a 20 candle average of OBV and a band 2 standard deviations above and below it. A breach is OBV entering the zone outside a band. The source treats it as a zone entry, not as a buy or sell call: the breach itself has no direction.
We defined turns strictly. A top is a 4 hour high with no higher high for 8 candles either side, that price then fell at least 3 ATR from within 20 candles. A bottom is the mirror. ATR is the market’s normal candle size.
What we measured
Every Plutus breach on TradingView’s WTI oil chart (TVC:USOIL), 4 hour candles, September 2023 to October 2026: 138 above the upper band and 151 below the lower one. For each: did a top, or a bottom, come within the next 10 candles? And how often does that happen after any candle at all? The question was written down before we ran it.
What followed
| Breach | Breaches | Turn within 10 candles (%) | Any candle (%) | Lift | Luck |
|---|---|---|---|---|---|
| +2 sigma, before a top | 138 | 46.4 | 31.6 | 1.47 | 0.2% |
| -2 sigma, before a bottom | 151 | 43.7 | 32.9 | 1.33 | 0.2% |
Lift is the breach’s share over the any-candle share. Luck is how often shifting the breaches to random candles gave a gap this size.
Both held with oil above and below its 50-day average, and in each third of the three years. We first found this on crypto, where the same top question gave 53.4% against 32.6%, and the bottom question 42.6% against 28.9%.
One check we added after the run. This oil chart switches futures contracts every month, and some switches leave a gap of several percent. We removed those gaps two different ways and ran it again. Tops: 46.7% against 31.6%, and 47.8% against 32.4%. Bottoms: 44.7% against 32.9%, and 50.5% against 35.0%.
What a breach didn’t tell you is the direction. Twenty candles after a +2 sigma breach oil was lower 51.4% of the time, against 48.6% for any candle. After a -2 sigma breach it was higher 49.7% of the time, against 51.4%.
On the chart
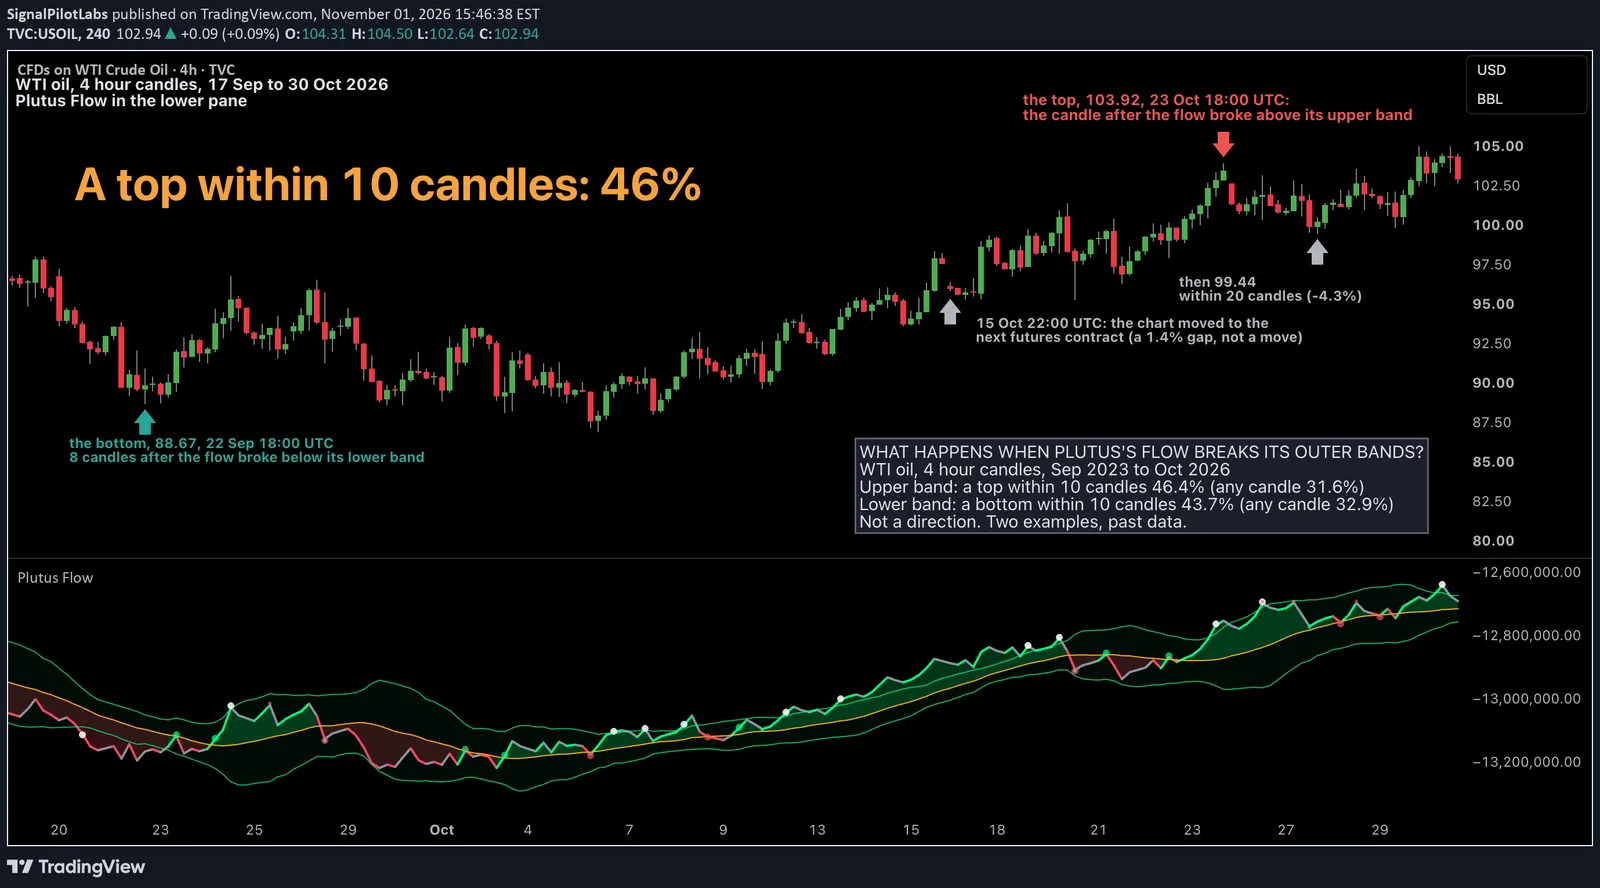
WTI, 4 hour, 17 September to 30 October 2026. On the 10:00 UTC candle of 21 September OBV dropped below Plutus’s lower band, with oil at 92.57. The bottom came 8 candles later: 88.67 on 22 September. On the 14:00 UTC candle of 23 October OBV pushed above the upper band, with oil at 102.84. The next candle made the top at 103.92. Within 20 candles oil was at 99.44, 4.3% under that high, and by 29 October it had climbed past it to 104.99.
Two examples, picked by a rule we wrote before looking: the most recent breach on each side followed by a turn within 10 candles, on candles to 30 October. The numbers above cover all 289 breaches.
In the lower pane the line is Plutus’s OBV, with its orange average and the green bands. The white dots mark breaches of the bands, and the small coloured dots mark OBV crossing its average. The volume here is tick volume, the number of price updates TradingView’s oil chart records, not contracts traded.
How to do it
- Add Plutus Flow to WTI’s 4 hour chart and watch OBV against both bands.
- When OBV breaks above the upper band, read it as “a top is more likely than usual within the next 10 candles”. When it breaks below the lower band, the same for a bottom.
- Don’t read either as a direction. Twenty candles later price had gone either way about as often as after any candle.
- The turn can come on the next candle, as on 23 October, or several candles later, as on 21 September.
What this does not tell you
Where the turn is, how far the move goes, or what to do about it. A top coming near doesn’t tell you to sell short, and oil can run further first. One market, one timeframe, three years, past data, no fees.
Observations, not recommendations.
We’re Signal Pilot Labs. We build the Elite Seven, seven indicators for TradingView, and we post what we measure, including the parts that didn’t work.
See what we build at signalpilot.io.
Published as a TradingView Idea on USOIL. View the chart on TradingView
Past measurement described after the fact. Nothing here is a recommendation or an indication of future results.