Published as a TradingView Idea on USOIL. View the chart on TradingView
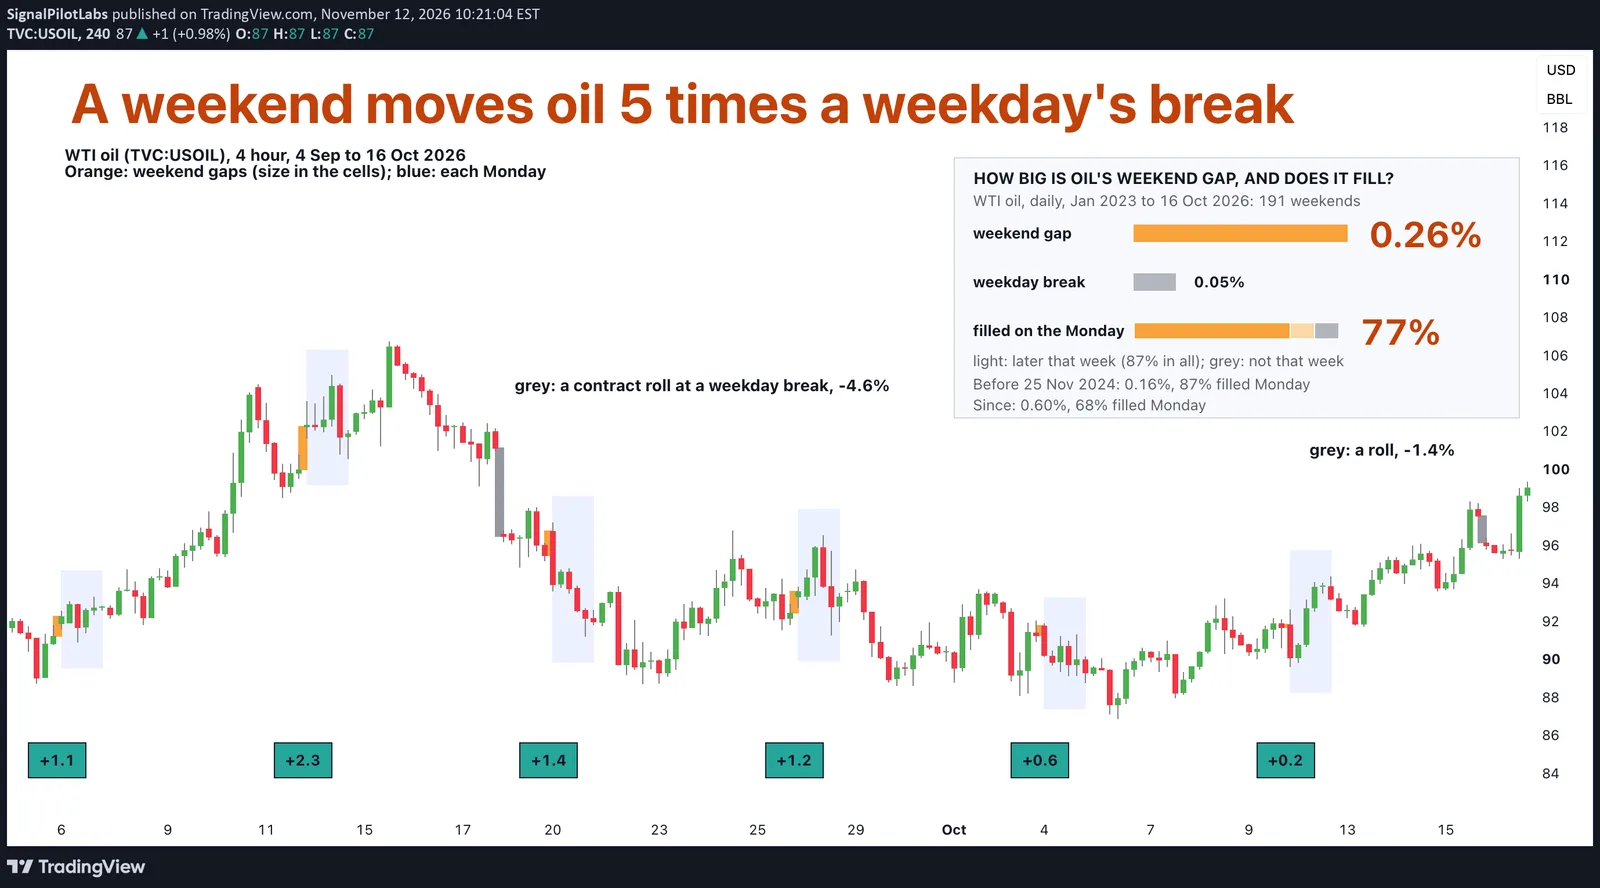
Does oil’s weekend gap fill on Monday? In 77% of cases since January 2023, it did. A typical weekend gap was 0.26%, 5 times the 0.05% at a weekday’s daily break.
What we measured
Oil stops trading from Friday evening to Sunday evening, but the news does not stop. So we took TradingView’s daily candles for WTI oil (TVC:USOIL) and measured each weekend’s gap: Monday’s first price, set when trading resumes on Sunday, against Friday’s close. We measured the same jump at each weekday’s daily break, for comparison. That gave 191 weekends and 759 weekday breaks, from January 2023 to 16 October 2026.
What we found
The median weekend gap, the middle one of the 191, was 0.26%. At a weekday break the median was 0.05%, about a fifth of that. Big weekends set oil apart: 44 of them, 23%, gapped more than 1%. Of those, 21 gapped more than 2%, which is 11% of all weekends. At a weekday break, only 16 of the 759 went over 1%.
| Gap size (%) | Weekends | Share of weekends (%) | Weekday breaks | Share of weekday breaks (%) |
|---|---|---|---|---|
| Under 0.25 | 92 | 48 | 692 | 91 |
| 0.25 to 0.5 | 28 | 15 | 31 | 4 |
| 0.5 to 1 | 27 | 14 | 20 | 3 |
| 1 to 2 | 23 | 12 | 10 | 1 |
| Over 2 | 21 | 11 | 6 | 1 |
The largest weekend gap came on Monday 2 March 2026, at +11.5%.
Do the gaps fill?
Mostly, and fast. In 145 of the 188 gaps, 77%, the price traded back to Friday’s close during the Monday session. By the end of the week 163 had, or 87%. That left 25 gaps still open when the week closed. The other 3 weekends had no gap at all, so they sit outside these counts.
Did it hold?
We split the 191 weekends into halves afterwards, a check we had not declared. Before 25 November 2024 the median gap was 0.16%, and 87% filled on the Monday. Since then it has been 0.60%, with 68% filled on the Monday.
A weekday break barely changed, 0.05% and then 0.06%, so the weekend’s lead grew from about 3 times to about 10. Most of the rise came in 2026, when the 39 weekends had a median gap of 1.38%. Oil futures on NYMEX show the same jump, so it is not a quirk of this price feed.
Two things we fixed along the way
We first planned five years, from October 2021. In that data, 49 of the first 62 Monday opens equal Friday’s close exactly: a quirk of the data feed, not a quiet market. From January 2023 the daily gaps match the hourly candles, so the record starts there.
TradingView’s oil price also switches futures contracts each month at a weekday break, and a switch can move the price by several percent. So we checked the weekend numbers again without every Monday dated the 12th to the 21st. The picture held: a median of 0.25%, with 21% of weekends over 1% and 13% over 2%.
Before you hold oil over a weekend
A weekday break barely moves it. The weekend does: more than 1% about one weekend in four, more than 2% about one in nine. Our post on a normal week in energy measured how far oil moves in a whole week: its normal week grew from 5.5% to 9.2%.
On the chart
WTI oil in 4 hour candles, 4 September to 16 October 2026. The orange boxes mark each weekend’s gap, from Friday’s close to Sunday’s open, and the cells under them give its size in percent. Each Monday is shaded blue, because that session is where a fill counts. Five of the six gaps filled on their Monday, and the +2.3% of 14 September filled later that week. The two grey boxes are contract rolls at a Thursday evening break, not weekends.
How to measure a weekend gap yourself
- Take daily candles and compare each Monday’s open with the close before it.
- Do the same for the other weekdays, so you know what a normal break looks like.
- Look for runs of exact zeros and for the contract’s roll dates before you trust the numbers.
What this does not tell you
Which way the next weekend will gap, or whether it will fill. The gaps leaned up here, 111 against 77, in a market that rose. That describes the past, not the next weekend. We ran no luck test, since nothing here claims a rule. Past data.
Observations, not recommendations.
We’re Signal Pilot Labs. We build the Elite Seven, seven indicators for TradingView, and we post what we measure, including the parts that didn’t work.
See what we build at signalpilot.io.
Published as a TradingView Idea on USOIL. View the chart on TradingView
Past measurement described after the fact. Nothing here is a recommendation or an indication of future results.