Published as a TradingView Idea on EURUSD. View the chart on TradingView
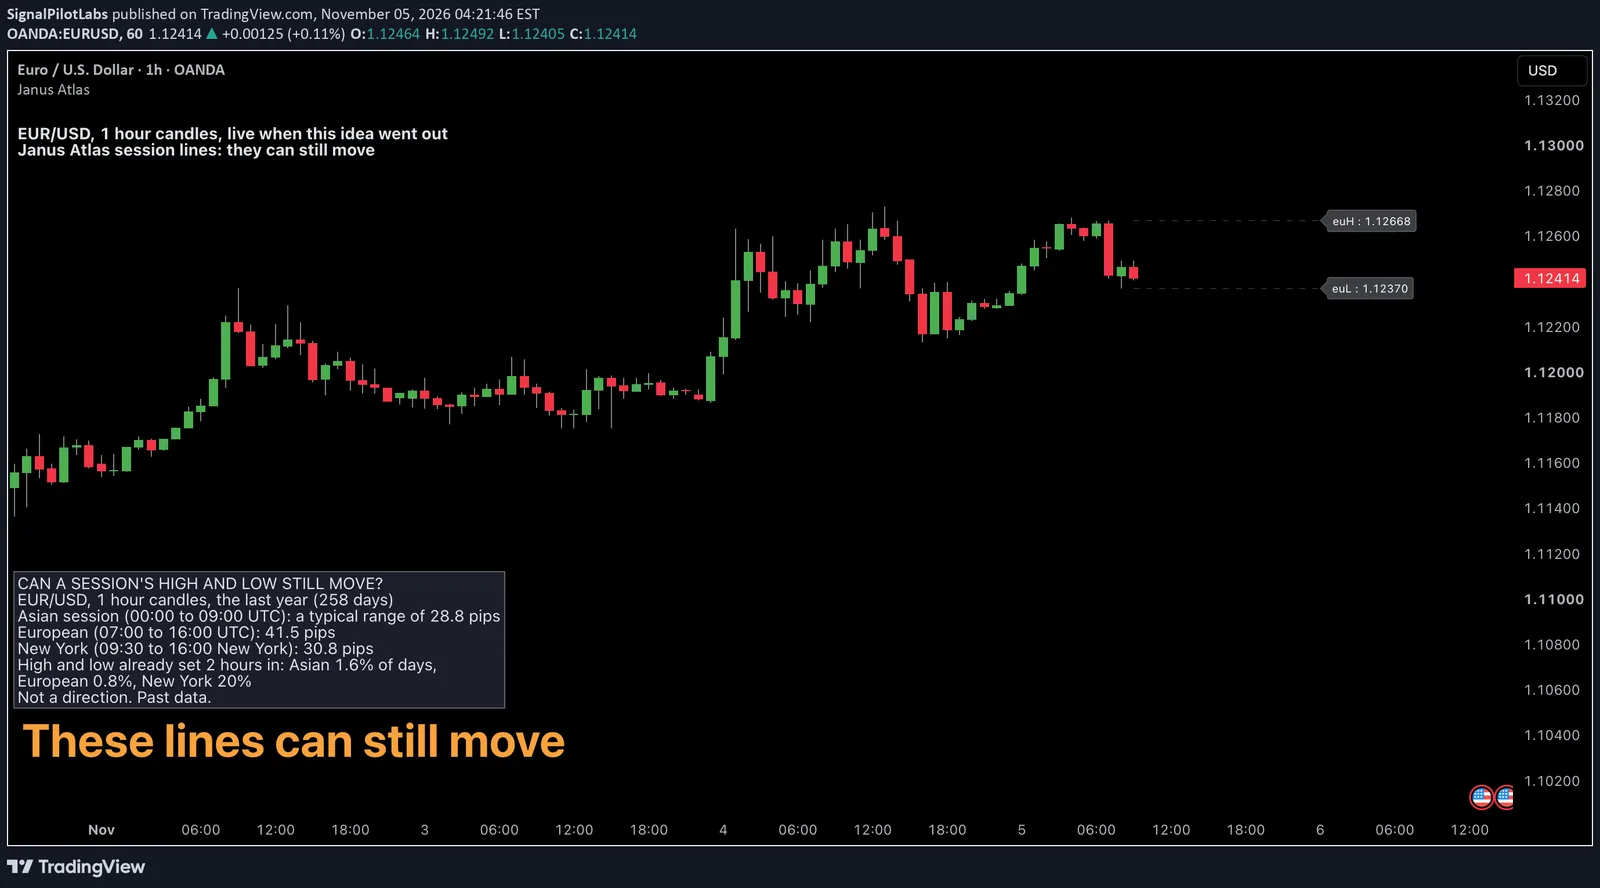
Janus Atlas marks the high and low of three market sessions: Asian, 00:00 to 09:00 UTC, European, 07:00 to 16:00 UTC, and New York, 09:30 to 16:00 New York time. Janus draws a session’s lines only while that session runs, at the high and low so far, so the lines you’re looking at can still move. We measured how often they do on EUR/USD.
How Janus draws a session
Since version 4.0 each session keeps its own time zone, so New York’s session follows New York’s clock through the summer and winter changes. While a session runs, Janus redraws its high and low on every candle as they change. When the session ends, the lines are deleted.
What we measured
OANDA EUR/USD, 1 hour candles, the 258 trading days from 13 October 2025 to 9 October 2026, with the year before beside it. On a 1 hour chart a candle belongs to a session by its opening time, so New York’s session is the 10:00 to 15:00 New York candles. The questions were written down before we read the data.
How big a session is
Median range: Asian 28.8 pips, European 41.5, New York 30.8. One day in ten, a session went past about 49, 72 and 60 pips.
How soon the lines are final
| Session | Hours | Median range (pips) | High final after 2 candles (%) | Low final after 2 candles (%) | Both final after 2 candles (%) | Both final with 2 candles left (%) |
|---|---|---|---|---|---|---|
| Asian | 00:00 to 09:00 UTC | 28.8 | 30.2 | 30.6 | 1.6 | 20.2 |
| European | 07:00 to 16:00 UTC | 41.5 | 32.2 | 31.0 | 0.8 | 33.7 |
| New York | 09:30 to 16:00 New York time | 30.8 | 61.6 | 50.8 | 20.2 | 51.9 |
After London’s first two hours, its high was already the day’s European high 32% of the time, and its low 31%. Both were final on 2 of the 258 days.
Asia looks the same: 30% and 31% after two hours, both on 4 days.
New York settles faster. Its 10:00 candle set the session’s high 43% of the time, and after two candles both lines were final on 20% of days.
The end of a session still matters. With two London candles left, both lines were final only 34% of the time. Session highs and lows bunch at the first and last candles: London’s high came on its first candle 24% of days and on its last 22%.
The year before, the sessions were bigger (Asia 39.3 pips, London 60.4, New York 42.4) but the timing was the same: both London lines final after two hours on 1.2% of days.
On the chart
EUR/USD, 1 hour, at the moment the idea went out. The dashed lines on the right are the sessions running then, each labelled with its price: as, eu and na for Asian, European and New York, H and L for high and low.
Janus’s other levels have their own posts: last week’s high and whether a limit order at a level fills, both measured the same way.
How to do it
- Add Janus Atlas and turn on Session Levels. Leave the session zones at their defaults: UTC, UTC and New York.
- Read each line as the session so far. It’s redrawn on every candle and disappears when the session ends.
- Early in a session, expect one line to hold at most. After London’s first two hours one of them is often final, both almost never.
- Don’t treat a session’s range as done until it ends. The last two hours moved a London line on two days in three.
What this does not tell you
Which line breaks, or which way price goes. One pair, 1 hour candles, two years, OANDA’s data.
Observations, not recommendations.
We’re Signal Pilot Labs. We build the Elite Seven, seven indicators for TradingView, and we post what we measure, including the parts that didn’t work.
See what we build at signalpilot.io.
Published as a TradingView Idea on EURUSD. View the chart on TradingView
Past measurement described after the fact. Nothing here is a recommendation or an indication of future results.