Published as a TradingView Idea on ZROUSDT. View the chart on TradingView
Harmonic Oscillator blends several momentum readings into one composite line from 0 to 100. When it closes a 4 hour candle at 15 or below, it prints Extreme Oversold. The tempting reading is “this is the bottom”. We measured what the print actually told you.
What the composite is
The composite is a single line built from Harmonic’s momentum readings, and it moves on closed candles. On the 15 minute, 1 hour and 4 hour charts, Extreme Oversold prints when it closes at 15 or below; on higher timeframes the line is 20. Because it waits for the close, it can trail a fast move.
What we measured
Every Extreme Oversold print on the 4 hour chart of 65 crypto perpetual futures on Bybit, April 2025 to October 2026: 731 of them. For each one: how far had price already dropped, and did the print candle’s low hold for the next 12 candles, two days?
What the print told you
| Reading | Median or share |
|---|---|
| Prints | 731, on 65 coins |
| Drop behind the print (median) | 3.9 ATR, 12.3% |
| The print candle’s low held for the next 12 candles | 17.8% |
| When it didn’t, the low came (median) | 6 candles later, 0.95 ATR deeper |
| A lower low had already printed in the 12 candles before | 52.4% |
| Best close of the next 12 candles (median) | 0.97 ATR above the print’s close |
| Best close at least 1 ATR above | 49.4% |
| Bitcoin, Ether and Solana: the print’s low held | 2 of 46 |
How deep the drop was. At the median, price had fallen 3.9 ATR, or 12.3%, from the highest close of the 12 candles before the print. ATR is a coin’s normal candle size, so 3.9 of them in two days is a large move on any coin.
Not where the low was. The print candle’s low held for the next 12 candles only 17.8% of the time. When it didn’t, the low came a median six candles later, 0.95 ATR under the print’s low. On Bitcoin, Ether and Solana it held in 2 of 46 prints.
And in 52% of the prints a lower low had already happened in the 12 candles before it. The composite moves on closed candles and lags a fast flush.
Price usually bounced at some point too: the best close of the next 12 candles was a median 1 ATR above the print’s close.
On the chart
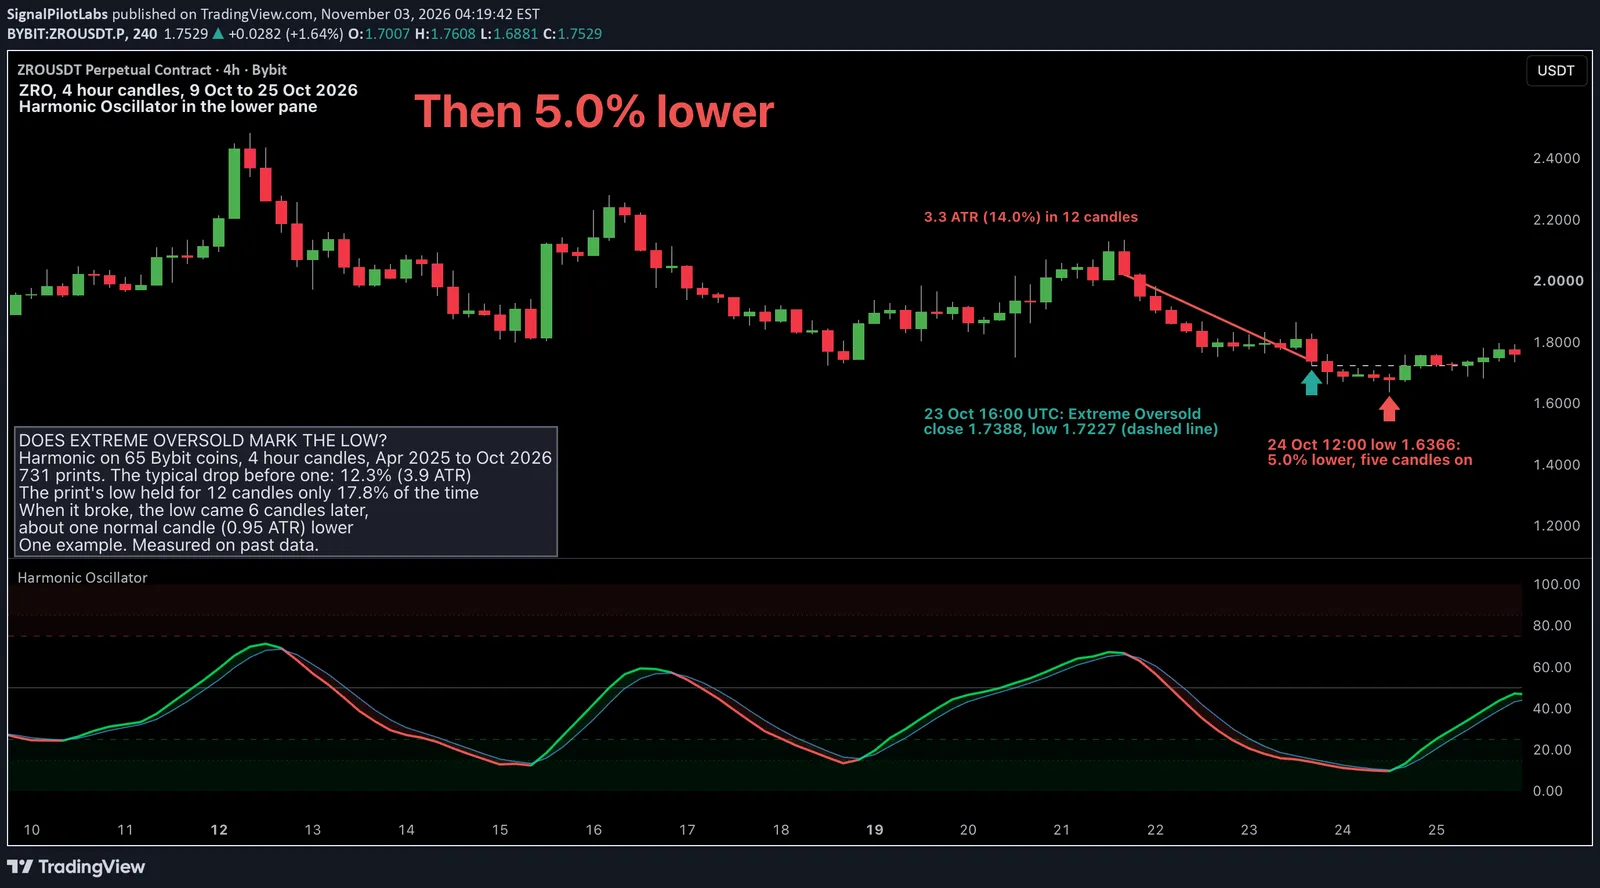
ZRO, 4 hour, 9 to 25 October 2026. From a close of 2.0213 at 16:00 UTC on 21 October, ZRO fell 3.3 ATR (14.0%) in 12 candles, and Harmonic printed Extreme Oversold on the 16:00 candle of 23 October: close 1.7388, low 1.7227.
ZRO kept falling. At 12:00 on 24 October it made its low, 1.6366: five candles after the print and 1.02 ATR (5.0%) under the print’s low, close to the typical case. Exit Oversold printed eight hours later, and on 25 October ZRO closed back at 1.7762.
It’s one example, picked by a rule: the most recent print that was the lowest point when it printed, with a later low near the typical depth. The numbers above cover all 731.
In the lower pane the line is Harmonic’s composite, and the shaded bands at the top and bottom are its extreme zones.
Harmonic’s other extreme, Overbought on 4H, is in our post on Overbought, an ENA example.
How to do it
- Keep “Show OB/OS Zone Fills” on in Harmonic Oscillator, so the extreme zones are visible.
- When Extreme Oversold prints on 4H, read it as “this drop is already deep”: about 4 ATR at the median.
- Don’t treat the print candle’s low as the floor. Four times out of five it was broken within two days.
- Read about 1 ATR under that low as the room the move usually took before it was done.
What this does not tell you
This describes what the prints looked like. It doesn’t compare them with other coins or random moments, and it isn’t a trade or a stop rule. One timeframe, one exchange, past data.
Observations, not recommendations.
We’re Signal Pilot Labs. We build the Elite Seven, seven indicators for TradingView, and we post what we measure, including the parts that didn’t work.
See what we build at signalpilot.io.
Published as a TradingView Idea on ZROUSDT. View the chart on TradingView
Past measurement described after the fact. Nothing here is a recommendation or an indication of future results.