Published as a TradingView Idea on XAUUSD. View the chart on TradingView
Does gold have a good month and a bad month? We took every month from January 2010 to September 2026 and measured gold’s change in each.
What we measured
TradingView monthly candles for gold (OANDA:XAUUSD) over that span: 201 months. A month’s change is its close against the previous month’s close. For each calendar month, 17 years of it (the first nine months) or 16 (October to December): the median change and the number of years gold rose.
What we found
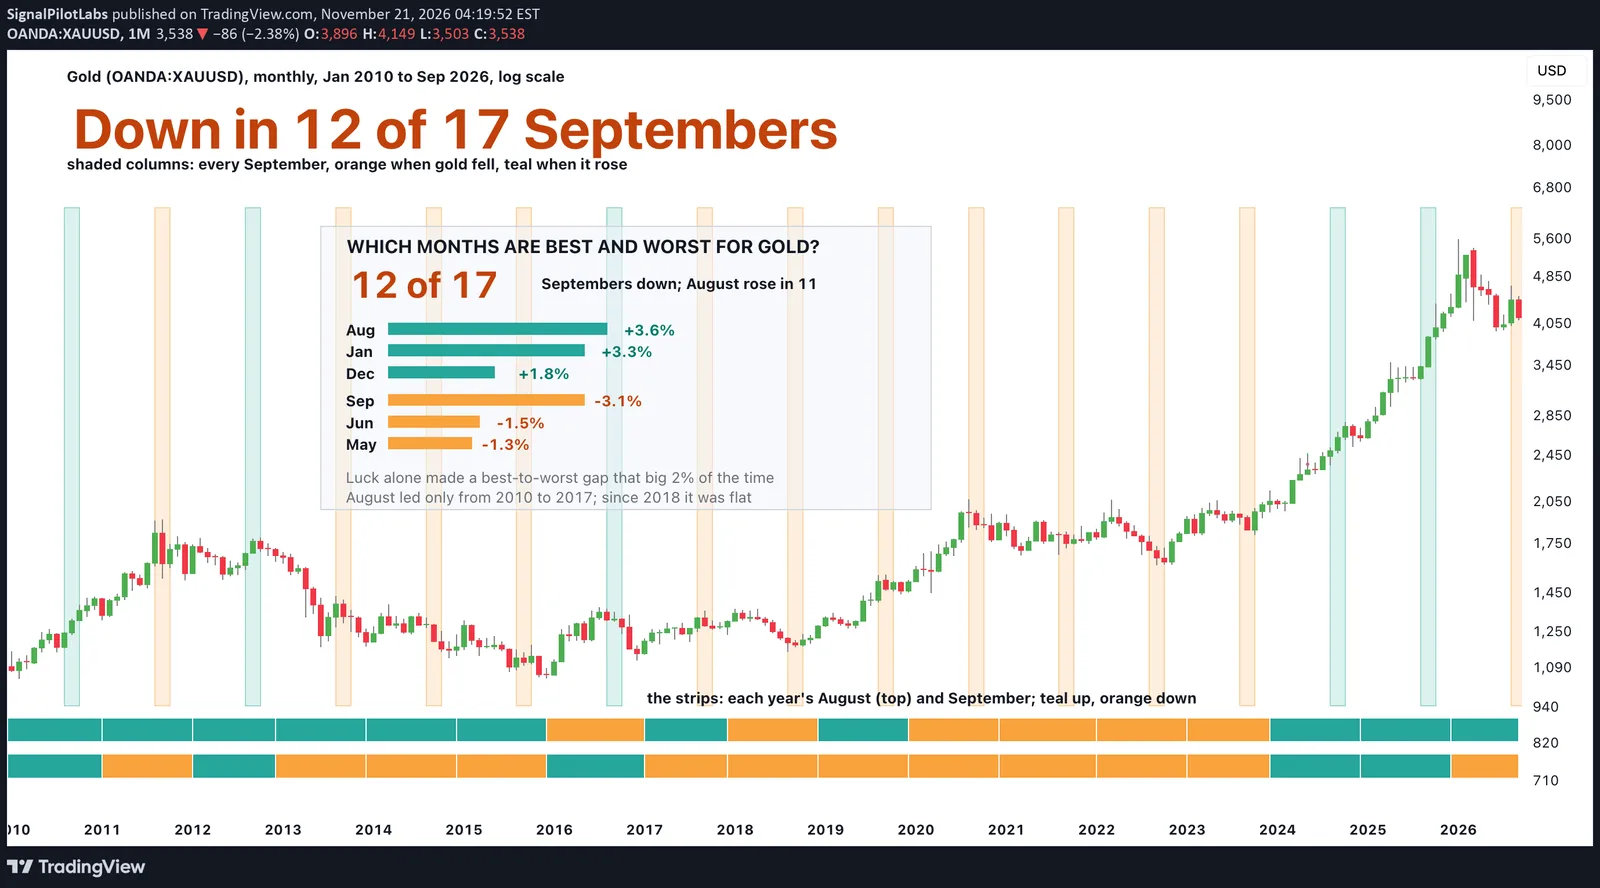
September was gold’s worst month: a median change of -3.1%, and gold rose in only 5 of 17 Septembers. From 2017 to 2023 it fell in seven Septembers in a row.
August was the best: a median of +3.6%, up in 11 of 17. January was close behind at +3.3%, also up in 11.
| Month | Median change (%) | Years gold rose | 2010 to 2017 (%) | 2018 to 2026 (%) |
|---|---|---|---|---|
| August | +3.6 | 11 of 17 | +4.4 | 0.0 |
| January | +3.3 | 11 of 17 | +4.2 | +3.2 |
| December | +1.8 | 10 of 16 | -1.1 | +3.1 |
| October | +1.7 | 9 of 16 | -0.6 | +2.3 |
| July | +1.1 | 11 of 17 | +1.6 | +0.9 |
| April | +1.0 | 11 of 17 | +1.1 | +1.0 |
| February | +0.3 | 9 of 17 | +3.3 | -0.2 |
| March | -0.4 | 8 of 17 | -0.4 | +0.5 |
| November | -0.4 | 7 of 16 | -0.4 | +0.1 |
| May | -1.3 | 8 of 17 | -2.5 | 0.0 |
| June | -1.5 | 7 of 17 | +0.3 | -1.6 |
| September | -3.1 | 5 of 17 | -2.4 | -3.1 |
Is the gap real or luck?
Twelve months will always have a best and a worst. To test that, the 201 monthly changes were dealt out to random month labels 10,000 times, and each time we took the gap between the best and the worst month. In those shuffles, a gap as wide as August to September, 6.7 points, came up 2% of the time. It’s wider than random labels usually make.
Split the years in two and August’s lead goes: it was the best month from 2010 to 2017 and flat from 2018 to 2026. September held up better as the weak one, second worst in the first half and the worst in the second. January was strong in both.
Our post on how far gold moves in a normal week gives the size of an ordinary move to set these medians against.
On the chart
Gold, monthly, January 2010 to September 2026, on a log scale (each step up the axis is the same percentage move). Its light columns mark every September, orange where gold fell that month and teal where it rose. The two strips along the bottom give each year one cell: the top row is that year’s August, the bottom row its September, teal where gold rose that month and orange where it fell.
How to check a season on your own market
- Take as many years of monthly closes as you can, and work out each month’s change from the month before.
- Sort the changes into the twelve calendar months; for each, note the middle change and how many years it rose.
- Shuffle the calendar labels among the figures many times, and count how often the best and worst end up as far apart as yours.
- Split the years in two. A real season shows up in both halves.
What this does not tell you
What gold does next September. Sixteen or seventeen years per month is a small sample, a calendar month is not a cause, and the best month changed between the two halves. Past data.
Observations, not recommendations.
We’re Signal Pilot Labs. We build the Elite Seven, seven indicators for TradingView, and we post what we measure, including the parts that didn’t work.
See what we build at signalpilot.io.
Published as a TradingView Idea on XAUUSD. View the chart on TradingView
Past measurement described after the fact. Nothing here is a recommendation or an indication of future results.