Published as a TradingView Idea on SPX. View the chart on TradingView
Is Friday the 13th unlucky for the market? The superstition calls it the unluckiest day on the calendar. We checked every Friday of the S&P 500 since 1978 and of gold since 1985: did the market fall more often on a Friday the 13th than on its other Fridays?
What we measured
TradingView daily closes for the S&P 500 (SP:SPX), January 1978 to October 2026, and for gold (TVC:GOLD), February 1985 to October 2026. A Friday’s change is its close against the close of the day before, and it rose when that change was above zero. The S&P 500 had 2,452 Fridays, 81 of them on the 13th; gold had 2,032, 68 of them on the 13th. We wrote the rules and the bar down before setting a single Friday apart.
What we found
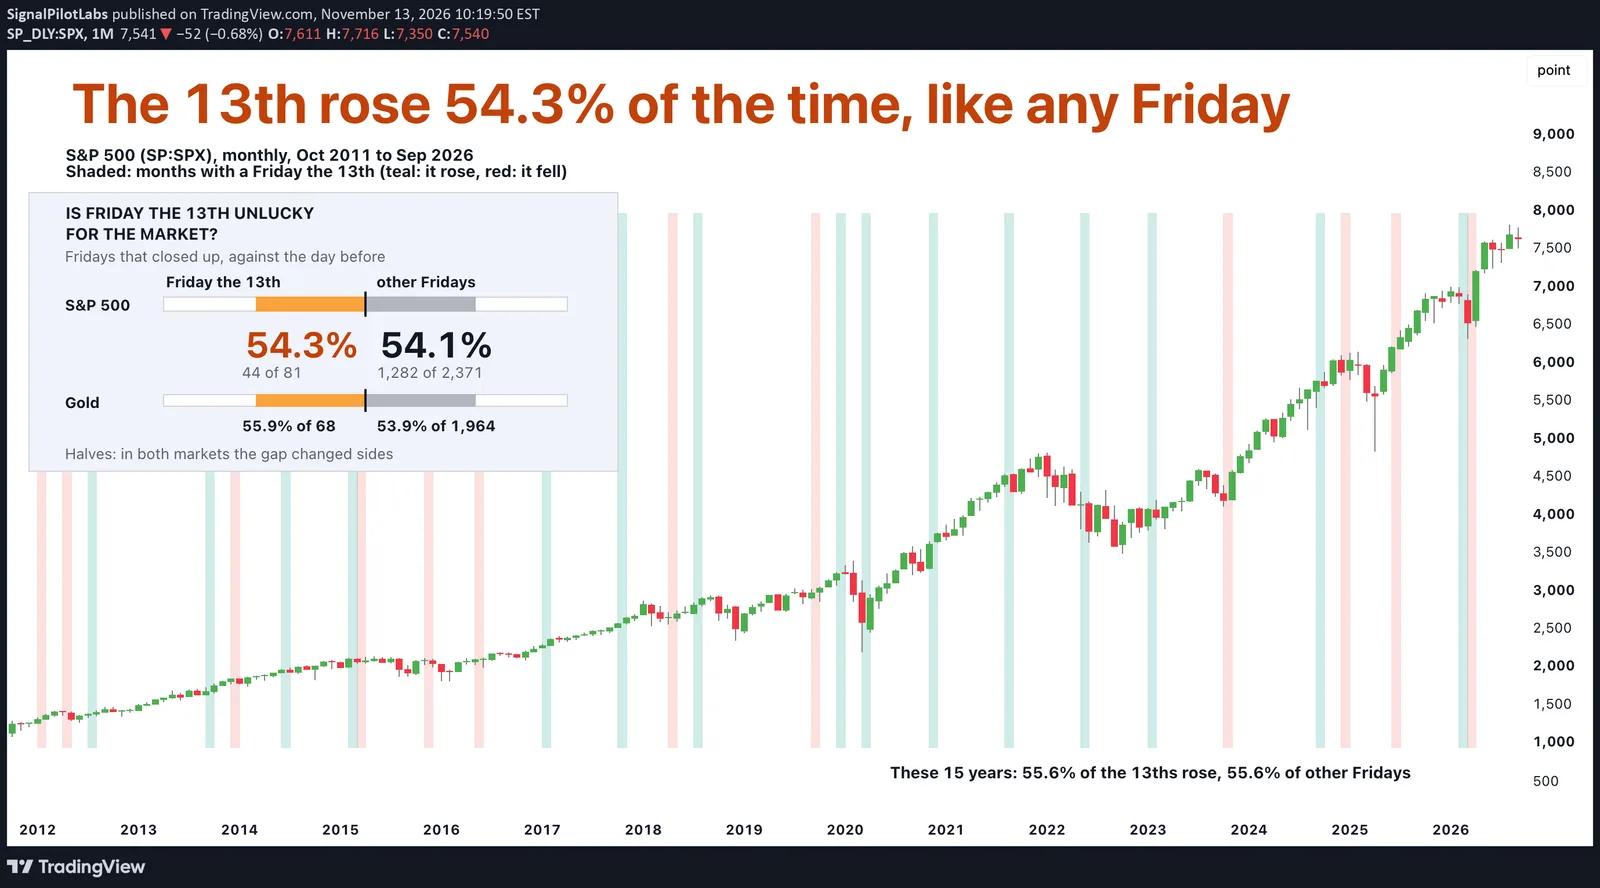
The S&P 500 rose on 44 of its 81 Fridays the 13th, 54.3%, and on 54.1% of its other Fridays. Gold rose on 38 of its 68, 55.9%, and on 53.9% of the others. The typical Friday the 13th was +0.09% for the S&P 500 (other Fridays +0.07%) and +0.17% for gold (other Fridays +0.08%).
| Market | Which Fridays | Fridays | Rose (%) | Typical change (%) | Fell 1% or more (%) |
|---|---|---|---|---|---|
| S&P 500 | Friday the 13th | 81 | 54.3 | +0.09 | 8.6 |
| S&P 500 | Other Fridays | 2,371 | 54.1 | +0.07 | 11.9 |
| Gold | Friday the 13th | 68 | 55.9 | +0.17 | 8.8 |
| Gold | Other Fridays | 1,964 | 53.9 | +0.08 | 9.7 |
Is it luck?
We drew as many Fridays as the 13ths at random, 10,000 times. For the S&P 500, every draw gave a gap at least as big as the real one: 0.3 points is the smallest gap 81 Fridays can make. For gold, 7,971 draws did. In both markets, one half of the record leaned one way and the other half the other. By the bar we set first, Friday the 13th behaved like any other Friday.
| Market | Years | Friday the 13th rose (%) | Other Fridays rose (%) |
|---|---|---|---|
| S&P 500 | February 1978 to June 2002 | 55.3 | 53.6 |
| S&P 500 | June 2002 to October 2026 | 53.5 | 54.5 |
| Gold | March 1985 to May 2006 | 46.9 | 50.9 |
| Gold | June 2006 to October 2026 | 63.9 | 56.8 |
The big falls
Falls of 1% or more came on 8.6% of the S&P 500’s Fridays the 13th, against 11.9% of its other Fridays; for gold, 8.8% against 9.7%. The typical size of a Friday’s move, up or down, was 0.48% on the S&P 500’s 13ths against 0.52% on its other Fridays, and 0.61% against 0.48% for gold. A description, not a tested claim.
On the chart
The S&P 500 monthly from October 2011 to September 2026, the last 180 months. We shaded each month that held a Friday the 13th: teal when that Friday rose, red when it fell. Over these 15 years, 55.6% of the 27 Fridays the 13th rose, and 55.6% of the 729 other Fridays did too.
The record’s biggest Friday the 13th fall came on 13 October 1989, -6.1%, and its biggest rise on 13 March 2020, +9.3%. We counted the chart’s years and those two days after the test, as descriptions.
What to do with it
Leave the date out of it: on these records, a Friday the 13th rose as often as any other Friday. Our post on the VIX after fear spiked measured the S&P 500’s next month, and our post on the S&P 500’s new highs counted the months it set a new record.
How to check it yourself
- On a daily chart of your market, note each Friday’s close against the close of the day before.
- Split the Fridays into those dated the 13th and the rest, and count the share that rose in each.
- Compare the shares, in each half of the record on its own.
What this does not tell you
Other markets and other unlucky dates. The days after the 13th. Two markets, daily closes. Past data.
Observations, not recommendations.
We’re Signal Pilot Labs. We build the Elite Seven, seven indicators for TradingView, and we post what we measure, including the parts that didn’t work.
See what we build at signalpilot.io.
Published as a TradingView Idea on SPX. View the chart on TradingView
Past measurement described after the fact. Nothing here is a recommendation or an indication of future results.