Published as a TradingView Idea on BTCUSDT. View the chart on TradingView
Crypto trades around the clock; the people trading it do not. We split each day into three sessions, Asia, Europe and the US, and measured how much of 50 Bybit coins’ movement came in each, from 16 October 2025 to 15 October 2026.
What we measured
Bybit hourly closes for the 50 most traded perpetuals: 8,760 hours. An hour’s move is the size of its change, up or down. The sessions follow the local clocks, summer time included: Asia from 00:00 UTC (09:00 in Tokyo) to 08:00 in London, Europe from 08:00 in London to 09:00 in New York, and the US from 09:00 in New York to 00:00 UTC. That makes the US session 10 or 11 hours a day, 44.4% of the year’s hours.
What we found
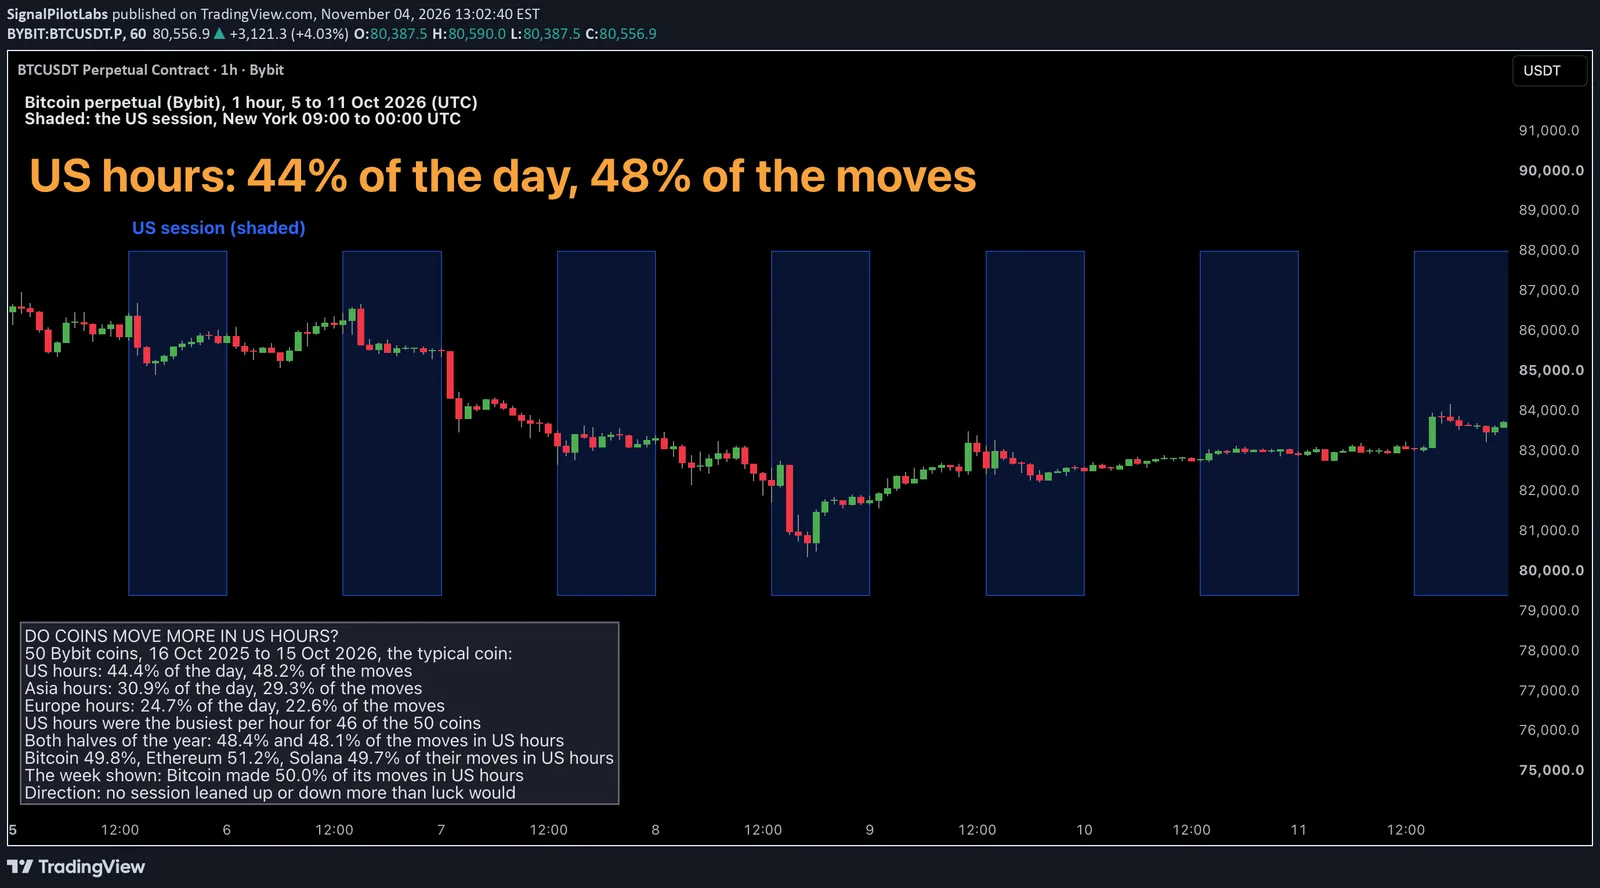
For the median coin, the US session held 44.4% of the hours and 48.2% of the movement. Asia held 30.9% of the hours and 29.3% of the movement; Europe 24.7% and 22.6%.
Per hour, the median coin moved 0.75% in US hours, 0.65% in Asia’s and 0.64% in Europe’s. US hours were the busiest for 46 of the 50 coins; the exceptions were AKE and BR, busiest in Europe’s hours, and DASH and LSK, in Asia’s. Bitcoin made 49.8% of its moves in US hours, Ethereum 51.2% and Solana 49.7%.
| Coin | US hours (% of its moves) | Asia (%) | Europe (%) | Busiest per hour |
|---|---|---|---|---|
| ETH | 51.2 | 27.2 | 21.5 | US |
| DOGE | 50.2 | 28.3 | 21.5 | US |
| 1000PEPE | 49.9 | 28.5 | 21.6 | US |
| BTC | 49.8 | 28.4 | 21.9 | US |
| FARTCOIN | 49.8 | 29.3 | 20.9 | US |
| SOL | 49.7 | 28.9 | 21.4 | US |
| AERO | 49.6 | 27.7 | 22.7 | US |
| WLD | 49.6 | 28.5 | 21.8 | US |
| FIL | 49.5 | 29.5 | 21.1 | US |
| LTC | 49.4 | 28.7 | 21.9 | US |
| XRP | 49.3 | 28.3 | 22.3 | US |
| LINK | 49.1 | 28.2 | 22.7 | US |
| OP | 49.0 | 29.4 | 21.6 | US |
| ADA | 48.8 | 29.0 | 22.2 | US |
| TIA | 48.8 | 29.1 | 22.1 | US |
| PENGU | 48.7 | 28.9 | 22.4 | US |
| PUMPFUN | 48.6 | 29.4 | 22.0 | US |
| DOT | 48.5 | 29.4 | 22.1 | US |
| ARB | 48.5 | 29.4 | 22.0 | US |
| ENA | 48.5 | 28.8 | 22.7 | US |
| AAVE | 48.4 | 28.8 | 22.8 | US |
| ZEC | 48.4 | 29.3 | 22.2 | US |
| AVAX | 48.4 | 29.5 | 22.1 | US |
| APT | 48.4 | 29.7 | 21.9 | US |
| SUI | 48.2 | 29.3 | 22.5 | US |
| HBAR | 48.2 | 28.8 | 23.0 | US |
| INJ | 48.1 | 29.3 | 22.6 | US |
| HYPE | 48.1 | 29.5 | 22.4 | US |
| XLM | 48.0 | 28.6 | 23.3 | US |
| ONDO | 48.0 | 28.9 | 23.1 | US |
| NEAR | 47.9 | 29.3 | 22.8 | US |
| XPL | 47.8 | 29.0 | 23.2 | US |
| USELESS | 47.5 | 28.3 | 24.1 | US |
| QNT | 47.4 | 29.0 | 23.6 | US |
| STRK | 47.2 | 29.6 | 23.2 | US |
| VVV | 47.1 | 31.0 | 21.9 | US |
| ZRO | 47.1 | 29.7 | 23.2 | US |
| UNI | 47.1 | 29.7 | 23.2 | US |
| BNB | 47.0 | 29.8 | 23.1 | US |
| TAO | 46.9 | 30.0 | 23.1 | US |
| TRUMP | 46.5 | 31.1 | 22.4 | US |
| RLC | 46.5 | 29.2 | 24.3 | US |
| SAND | 46.0 | 31.2 | 22.8 | US |
| BCH | 45.9 | 30.5 | 23.6 | US |
| XMR | 45.5 | 29.9 | 24.6 | US |
| DASH | 45.0 | 31.6 | 23.4 | Asia |
| MOVR | 44.7 | 31.1 | 24.2 | US |
| BR | 42.4 | 29.8 | 27.8 | Europe |
| LSK | 42.2 | 34.1 | 23.8 | Asia |
| AKE | 41.7 | 32.1 | 26.3 | Europe |
| Share of the hours | 44.4 | 30.9 | 24.7 |
Is it luck?
The two halves agree: 48.4% of the movement in US hours from October to April, 48.1% from April to October, and 48.5% counting weekdays only. The US share was above its share of the hours for 47 of the 50 coins.
Where the year was made
We also asked in which session each coin’s year was made. For the median coin, holding only through US hours lost 31.9% over the year, Europe’s hours 10.0% and Asia’s 5.1%.
That is not a pattern we can back. We took the 50 coins’ average return in each day’s US session and gave each day a random sign, 10,000 times: 8,179 of those years ended as far from zero as the real one, and Asia’s and Europe’s years were inside chance too. In the first half, the US hours were the best session for 21 coins and the worst for 19.
What to do with it
Expect the most movement in US hours on most coins, about 15% more per hour than in Asia’s. Set stops and alerts for that, and don’t read the session as a direction. Our post on the busiest hour of the day found 46 of the same 50 coins busiest at 14:00 or 15:00 UTC.
On the chart
Bitcoin, hourly, 5 to 11 October 2026, with each day’s US session shaded. That week Bitcoin made 50.0% of its moves in those 77 of 168 hours.
How to check a coin’s sessions yourself
- Take a year of the coin’s hourly closes and each hour’s move, up or down.
- Label each hour Asia, Europe or US by the local clocks.
- Add up each session’s moves and compare its share with its share of the hours.
What this does not tell you
Which way a coin will move, in any session. One year, one exchange. Past data.
Observations, not recommendations.
We’re Signal Pilot Labs. We build the Elite Seven, seven indicators for TradingView, and we post what we measure, including the parts that didn’t work.
See what we build at signalpilot.io.
Published as a TradingView Idea on BTCUSDT. View the chart on TradingView
Past measurement described after the fact. Nothing here is a recommendation or an indication of future results.