Published as a TradingView Idea on CRWV. View the chart on TradingView
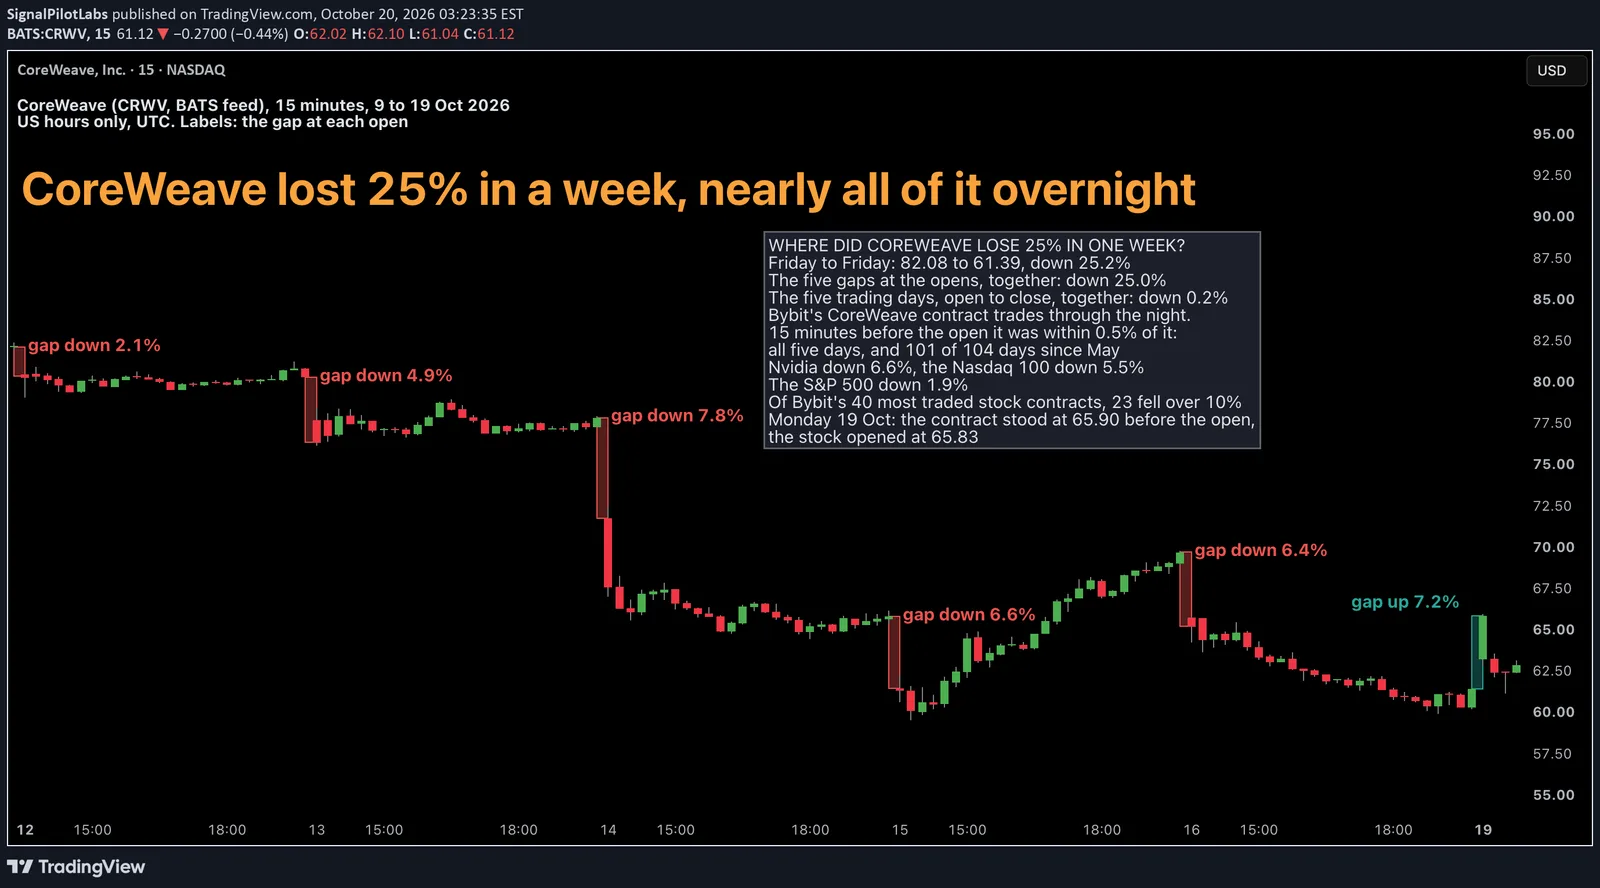
CoreWeave closed at 82.08 on Friday 9 October and at 61.39 on Friday 16 October: down 25.2% in five trading days. We split each day in two, the gap from the previous close to the open and the move from the open to the close. Nearly the whole fall sat in the gaps.
What we measured
TradingView daily candles of CoreWeave (CRWV, through TradingView’s BATS feed). For each day from 12 to 16 October, the gap is the open against the previous close and the session is the close against the open. Multiplied across the five days, the two parts give the week. We found this split reading the candles, so it was not a question we set before looking. The figures are plain arithmetic.
What we found
The stock opened lower on all five days. Together the five gaps took it down 25.0%. The five sessions, open to close, added up to a fall of just 0.2%.
| Day | Previous close | Open | Close | Gap at the open (%) | Open to close (%) | The day (%) |
|---|---|---|---|---|---|---|
| Mon 12 Oct | 82.08 | 80.33 | 80.26 | -2.1 | -0.1 | -2.2 |
| Tue 13 Oct | 80.26 | 76.32 | 77.81 | -4.9 | +2.0 | -3.1 |
| Wed 14 Oct | 77.81 | 71.74 | 65.78 | -7.8 | -8.3 | -15.5 |
| Thu 15 Oct | 65.78 | 61.43 | 69.69 | -6.6 | +13.4 | +5.9 |
| Fri 16 Oct | 69.69 | 65.20 | 61.39 | -6.4 | -5.8 | -11.9 |
| The week | 82.08 | 61.39 | -25.0 | -0.2 | -25.2 |
It was not new for this stock. Multiplied across its 385 trading days from 31 March 2025 to 9 October 2026, CoreWeave’s gaps came to +527% and its sessions to -67%.
Wednesday 14 October did the most: a gap of 7.8% at the open and another 8.3% in the session, down 15.5% on the day. Thursday opened 6.6% lower, touched 59.51 in its first hour, then rose 13.4% from the open, the only up day of the week. Friday gapped down 6.4% and fell another 5.8%.
Bybit’s contract saw each gap first
Bybit lists a CoreWeave contract that trades around the clock. At 13:15 UTC each morning, 15 minutes before the US open, it was already within 0.5% of where the stock then opened, on all five days. On Wednesday it stood at 71.88, and the stock opened at 71.74.
That was not one lucky week. Before checking the rest, we set a bar: within 0.5% of the open on at least 80% of trading days, with a typical miss under a quarter of the typical gap. Since Bybit listed the contract in May, it was within 0.5% on 101 of 104 trading days and within 1% on all of them. Its typical miss was 0.15%, against a typical gap of 2.0%. On all 51 days that gapped 2% or more, it had already moved the gap’s way.
Over the weekend, with the stock market shut, the contract traded between 57.57 and 66.44. At 13:15 UTC on Monday 19 October it stood at 65.90, and the stock opened at 65.83, 7.2% above Friday’s close.
It did not fall alone
Over the same five days Nvidia fell 6.6%, the Nasdaq 100 fell 5.5% and the S&P 500 fell 1.9%. We also took the 40 stock contracts most traded on Bybit in the week before, 5 to 11 October, and compared each one’s price at the US close on the two Fridays. 23 fell more than 10% and 9 more than 20%, among them Nebius, Dell, Lumentum and Cerebras. Only Apple and McDonald’s rose. CoreWeave’s own contract fell 25.3% and would have ranked fourth.
The calendar
Wednesday’s fall came on the day of the US consumer price release, with core inflation at 0.3% against 0.2% expected. Thursday brought the hottest print of the week, producer prices up 1.3% against 0.5% expected, and that was CoreWeave’s only up day. News coverage that week centred on CoreWeave’s debt. The candles show when the stock fell and with whom. They cannot say why.
On the chart
CoreWeave, 15 minute candles, US trading hours only, from the last minutes of 9 October to the first hour of 19 October. The red labels mark the gap at each open.
How to split a week yourself
- Take the stock’s open and close for each day, and the close of the day before the week starts.
- For each day, divide the open by the previous close (the gap) and the close by the open (the session).
- Multiply the five gaps together, and the five sessions together. Each result minus one is that part of the week.
- If the stock has a contract on a crypto exchange, read it 15 minutes before the US open: 13:15 UTC until US clocks change on 1 November, 14:15 UTC after.
What this does not tell you
One week, one stock: whether the next week splits the same way, or why this one did. Bybit’s contract and the stock are different markets that trade different hours. The 40 contracts were ranked by Bybit turnover, not by any index. Past data.
Observations, not recommendations.
We’re Signal Pilot Labs. We build the Elite Seven, seven indicators for TradingView, and we post what we measure, including the parts that didn’t work.
See what we build at signalpilot.io.
Published as a TradingView Idea on CRWV. View the chart on TradingView
Past measurement described after the fact. Nothing here is a recommendation or an indication of future results.