Published as a TradingView Idea on HG1!. View the chart on TradingView
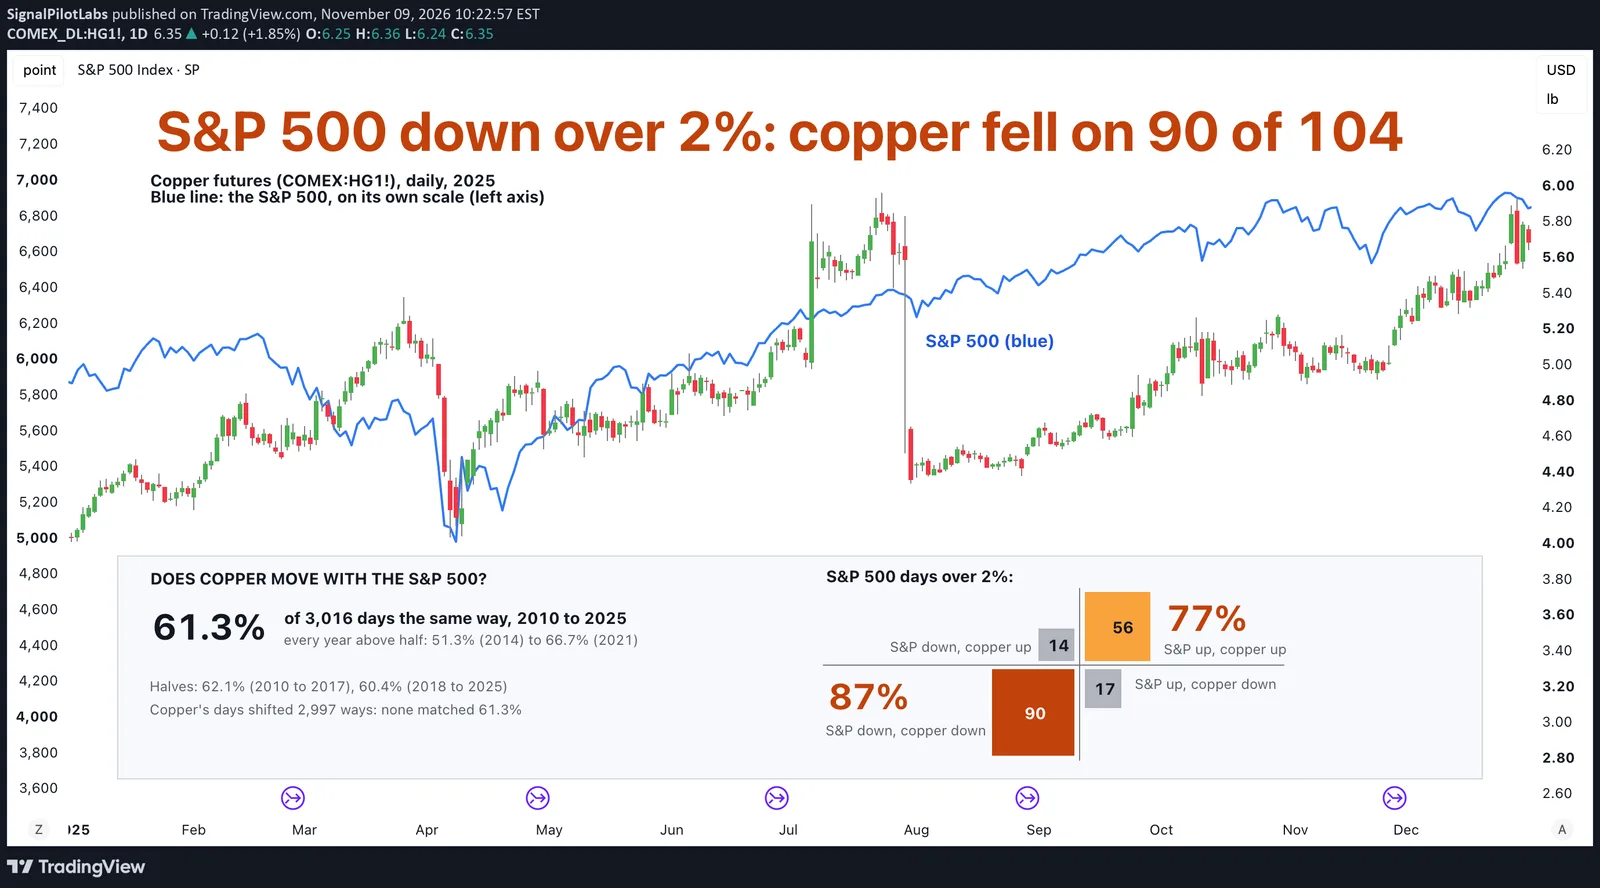
When the S&P 500 drops more than 2% in a day, does copper fall with it? From 2010 to 2025 it did on 90 of 104 such days, or 87%. Copper is called the metal with a degree in economics, so it should rise and fall with stocks. We measured how often the two moved the same way from one close to the next.
What we measured
TradingView daily closes for copper futures (COMEX HG1!, the front month) and the S&P 500, on the days both traded. Copper closes about an hour after the S&P. The front month switches to the next contract a few times a year, and a day across a switch carries the gap between contracts. So we left out the last 4 weekdays of every month and the first weekday of the next, for both markets: 3,036 days kept.
What we found
They moved the same way on 61.3% of the days, with a correlation of 0.31, where 1 would mean they always moved together and 0 no link at all. Every one of the 16 years was above half: the lowest was 2014 at 51.3%, the highest 2021 at 66.7%.
| Year | The same way (%) | Correlation | Days |
|---|---|---|---|
| 2010 | 66.3 | 0.44 | 191 |
| 2011 | 65.1 | 0.47 | 189 |
| 2012 | 65.4 | 0.53 | 190 |
| 2013 | 63.4 | 0.29 | 192 |
| 2014 | 51.3 | 0.13 | 191 |
| 2015 | 60.1 | 0.19 | 190 |
| 2016 | 65.1 | 0.40 | 190 |
| 2017 | 60.4 | 0.25 | 188 |
| 2018 | 56.3 | 0.15 | 190 |
| 2019 | 62.1 | 0.46 | 191 |
| 2020 | 59.8 | 0.41 | 191 |
| 2021 | 66.7 | 0.28 | 191 |
| 2022 | 58.3 | 0.29 | 187 |
| 2023 | 60.3 | 0.25 | 186 |
| 2024 | 60.7 | 0.16 | 191 |
| 2025 | 59.0 | 0.27 | 188 |
The big days are where it shows. On the 104 days the S&P fell more than 2%, copper fell on 90, 87%. On its 73 days up more than 2%, copper rose on 56, 77%.
Is it luck?
The two halves agree: 62.1% from 2010 to 2017, 60.4% from 2018 to 2025. Shifting copper’s days against the S&P’s, 2,997 ways, never gave a share as high; the highest was 53.3%. After the run we also checked the days we had left out: with every day in, the share is 60.5%.
What to do with it
Copper did not hedge stocks on their worst days: it fell with them almost 9 times in 10. Held together, copper and stocks behaved partly as one bet. Our post on 50 coins against the Nasdaq measured the same kind of tie in crypto.
On the chart
Copper, daily, 2025, with the S&P 500 drawn over it in blue on its own scale: read it on the left axis. Under the candles, the cross on the right sorts the S&P’s 104 drops and 73 rises of more than 2% by which way copper went, each square as big as its count of days. The orange squares are the days copper went the same way, the grey ones the days it did not. The purple marks are TradingView’s contract switches.
How to check two markets yourself
- Take both markets’ daily closes on the days both traded, and leave out any day across a contract switch.
- Count the days both moved the same way, year by year.
- Last, take the biggest days of one market and count which way the other went.
What this does not tell you
Which way either will go, or whether one leads the other. Past data.
Observations, not recommendations.
We’re Signal Pilot Labs. We build the Elite Seven, seven indicators for TradingView, and we post what we measure, including the parts that didn’t work.
See what we build at signalpilot.io.
Published as a TradingView Idea on HG1!. View the chart on TradingView
Past measurement described after the fact. Nothing here is a recommendation or an indication of future results.