Published as a TradingView Idea on BTCUSDT. View the chart on TradingView
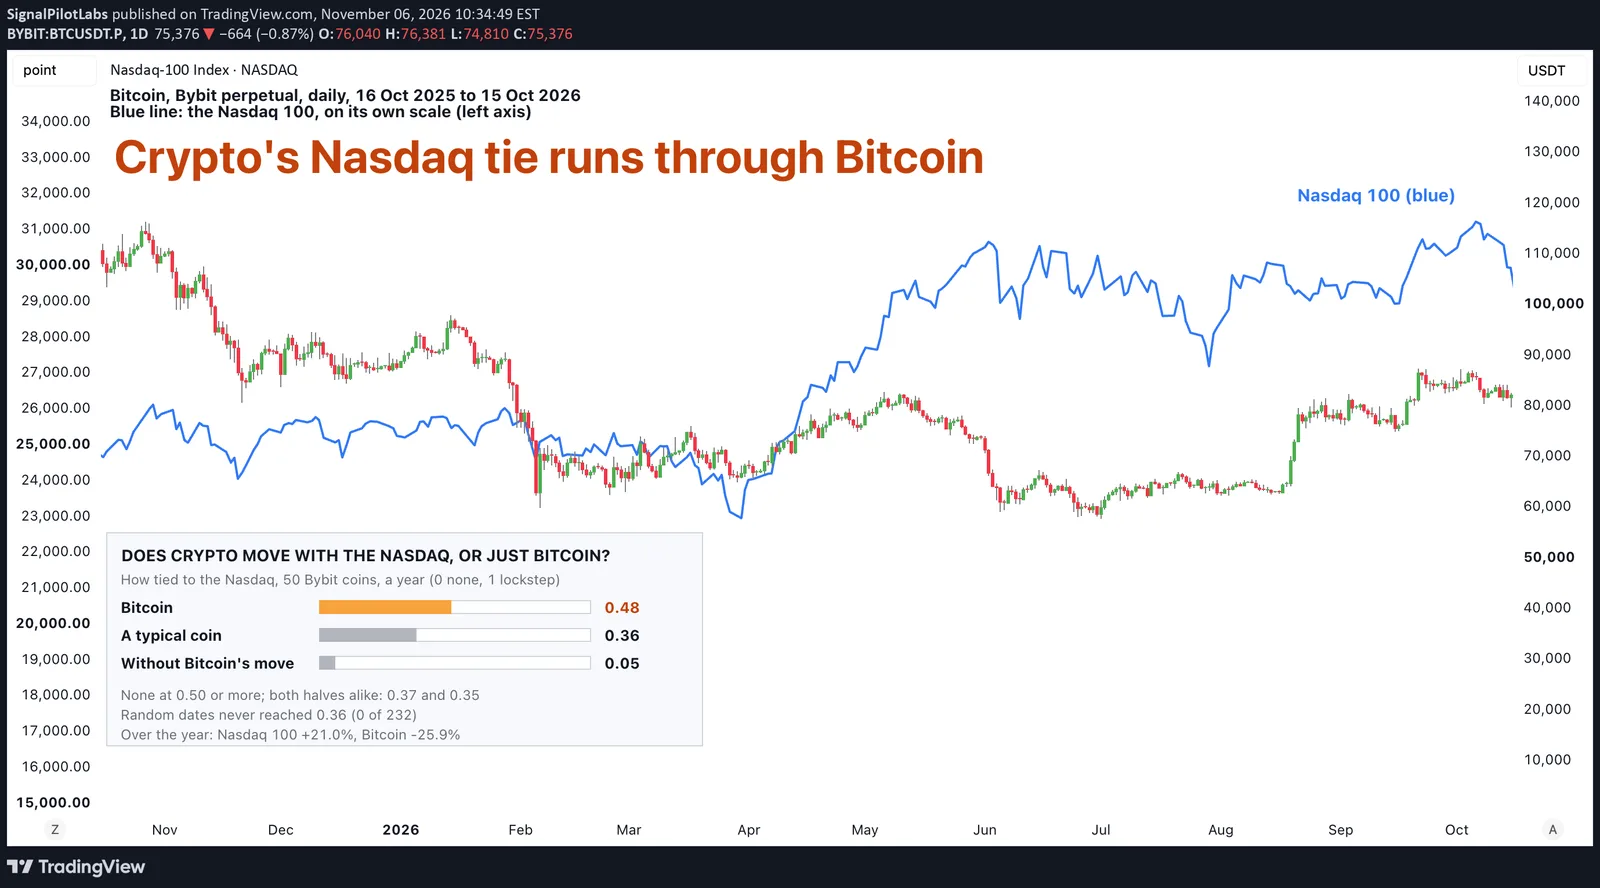
Crypto is often said to trade like tech stocks. We measured how closely each of 50 Bybit coins moved with the Nasdaq 100 over the year to 15 October 2026, and how much of that was Bitcoin.
What we measured
The Nasdaq 100’s 251 sessions from 16 October 2025 to 15 October 2026, close to close. Each coin was priced at the same moment, the Nasdaq’s close at 16:00 New York, from Bybit’s hourly candles, so a weekend folds into Monday for both. The tie is the correlation of the daily moves: 1 means they move in step, 0 means no relation.
What we found
Bitcoin moved most with the Nasdaq, at 0.48, then ETH (0.48), ADA (0.46), AVAX and XRP (0.45) and SOL (0.44). The median coin: 0.36. No coin reached 0.50, and 9 were under 0.25; LSK (0.01) and AKE (0.03) barely moved with it at all.
Then we took Bitcoin’s own move out of each coin and out of the Nasdaq. The median coin’s tie fell from 0.36 to 0.05, and no coin stayed above 0.20. Most of a coin’s link to the Nasdaq is its link to Bitcoin, passed along.
The table gives every coin’s tie to the Nasdaq, to Bitcoin on the same days, to the Nasdaq once Bitcoin’s move is taken out, and to the Nasdaq in each half of the year. The tie to Bitcoin here is measured on the Nasdaq’s sessions, not on every day.
| Coin | With the Nasdaq | With Bitcoin | With the Nasdaq, Bitcoin taken out | First half | Second half |
|---|---|---|---|---|---|
| BTC | 0.48 | 1.00 | 0.57 | 0.42 | |
| ETH | 0.48 | 0.92 | 0.11 | 0.56 | 0.43 |
| ADA | 0.46 | 0.82 | 0.13 | 0.44 | 0.49 |
| AVAX | 0.45 | 0.78 | 0.13 | 0.46 | 0.44 |
| XRP | 0.45 | 0.87 | 0.07 | 0.51 | 0.40 |
| SOL | 0.44 | 0.87 | 0.05 | 0.48 | 0.43 |
| LINK | 0.43 | 0.84 | 0.04 | 0.47 | 0.40 |
| XLM | 0.42 | 0.67 | 0.15 | 0.45 | 0.40 |
| SUI | 0.41 | 0.79 | 0.04 | 0.45 | 0.37 |
| DOGE | 0.40 | 0.82 | 0.01 | 0.41 | 0.44 |
| LTC | 0.40 | 0.76 | 0.06 | 0.42 | 0.41 |
| BNB | 0.40 | 0.83 | 0.00 | 0.40 | 0.43 |
| FARTCOIN | 0.40 | 0.69 | 0.11 | 0.37 | 0.47 |
| NEAR | 0.39 | 0.60 | 0.15 | 0.35 | 0.44 |
| TAO | 0.39 | 0.66 | 0.11 | 0.30 | 0.51 |
| ENA | 0.38 | 0.68 | 0.08 | 0.39 | 0.37 |
| ONDO | 0.38 | 0.64 | 0.10 | 0.39 | 0.37 |
| AAVE | 0.38 | 0.70 | 0.06 | 0.44 | 0.32 |
| OP | 0.37 | 0.66 | 0.08 | 0.32 | 0.44 |
| HBAR | 0.37 | 0.69 | 0.06 | 0.48 | 0.27 |
| HYPE | 0.37 | 0.55 | 0.14 | 0.31 | 0.44 |
| SAND | 0.37 | 0.60 | 0.10 | 0.34 | 0.39 |
| BCH | 0.36 | 0.62 | 0.09 | 0.39 | 0.35 |
| ZEC | 0.36 | 0.53 | 0.14 | 0.31 | 0.44 |
| PENGU | 0.36 | 0.76 | -0.02 | 0.40 | 0.34 |
| APT | 0.35 | 0.70 | 0.02 | 0.32 | 0.42 |
| INJ | 0.35 | 0.63 | 0.07 | 0.38 | 0.34 |
| TIA | 0.35 | 0.65 | 0.05 | 0.36 | 0.35 |
| AERO | 0.35 | 0.68 | 0.03 | 0.44 | 0.27 |
| 1000PEPE | 0.35 | 0.71 | 0.01 | 0.32 | 0.39 |
| ARB | 0.35 | 0.64 | 0.05 | 0.39 | 0.31 |
| WLD | 0.34 | 0.49 | 0.14 | 0.36 | 0.33 |
| PUMPFUN | 0.32 | 0.61 | 0.04 | 0.37 | 0.29 |
| USELESS | 0.32 | 0.55 | 0.08 | 0.37 | 0.28 |
| ZRO | 0.31 | 0.48 | 0.10 | 0.29 | 0.34 |
| DOT | 0.31 | 0.57 | 0.04 | 0.31 | 0.31 |
| XPL | 0.29 | 0.52 | 0.05 | 0.29 | 0.30 |
| UNI | 0.29 | 0.64 | -0.03 | 0.41 | 0.18 |
| TRUMP | 0.28 | 0.53 | 0.03 | 0.30 | 0.26 |
| RLC | 0.28 | 0.43 | 0.09 | 0.43 | 0.23 |
| XMR | 0.26 | 0.56 | -0.02 | 0.33 | 0.19 |
| VVV | 0.25 | 0.44 | 0.05 | 0.24 | 0.30 |
| STRK | 0.23 | 0.44 | 0.02 | 0.18 | 0.26 |
| FIL | 0.20 | 0.46 | -0.02 | 0.13 | 0.36 |
| MOVR | 0.19 | 0.27 | 0.07 | 0.35 | 0.17 |
| DASH | 0.14 | 0.28 | 0.00 | 0.11 | 0.27 |
| QNT | 0.05 | 0.18 | -0.05 | 0.21 | 0.00 |
| BR | 0.04 | 0.15 | -0.04 | 0.14 | 0.00 |
| AKE | 0.03 | 0.12 | -0.03 | 0.16 | -0.02 |
| LSK | 0.01 | 0.15 | -0.07 | 0.22 | -0.05 |
Is it luck?
The tie held in both halves of the year: 0.37, then 0.35. Shifting the Nasdaq’s days against the coins, 232 ways, never gave a median tie as high; the highest was 0.21. After the run we ran the same shifts on the tie left once Bitcoin is out: 10 of 232 reached its 0.05. A small tie may remain. It is small.
Together is not the same way
Over the same year the Nasdaq 100 rose 21.0% and Bitcoin fell 25.9%. Correlation is about the day-to-day moves, not where the year ends.
What to do with it
Before treating a coin as a bet on tech stocks, check its tie to Bitcoin. This year, that tie carried almost all of its link to the Nasdaq: the four coins least tied to the Nasdaq, LSK, AKE, BR and QNT, were also the four least tied to Bitcoin. Our post on Bitcoin’s 3% down days shows how far each coin fell with Bitcoin on those days: USELESS 7.9%, XMR 2.5%.
On the chart
Bitcoin, daily, 16 October 2025 to 15 October 2026. The blue line is the Nasdaq 100, drawn over it on its own scale: read it on the left axis.
How to check a coin against a stock index yourself
- Take the index’s daily closes, and the coin’s price at the same moment, the index’s close.
- Correlate the moves from one close to the next, a weekend folded into Monday.
- Then take Bitcoin’s move out and see what is left.
What this does not tell you
Whether the tie will hold, or which way either will go. One year, one exchange. Past data.
Observations, not recommendations.
We’re Signal Pilot Labs. We build the Elite Seven, seven indicators for TradingView, and we post what we measure, including the parts that didn’t work.
See what we build at signalpilot.io.
Published as a TradingView Idea on BTCUSDT. View the chart on TradingView
Past measurement described after the fact. Nothing here is a recommendation or an indication of future results.