Published as a TradingView Idea on SOX. View the chart on TradingView
In October 2026 the PHLX Semiconductor index (NASDAQ:SOX) closed 15.36% below September, after a 20.61% fall in July. Do chip stocks bounce after a month like that? We checked every month since 1994.
What we measured
The chip index’s monthly closes, June 1994 to October 2026: 389 months. It closed 10% or more lower in 43 of them. For each of those months we asked two things: was the index higher a month later, and three months later, more often than after the other months?
We wrote both tests and the bar down before pairing any month. A rule needed a higher share, fewer than 5% of 10,000 random draws doing as well, and the same lean in both halves of the record.
What we found
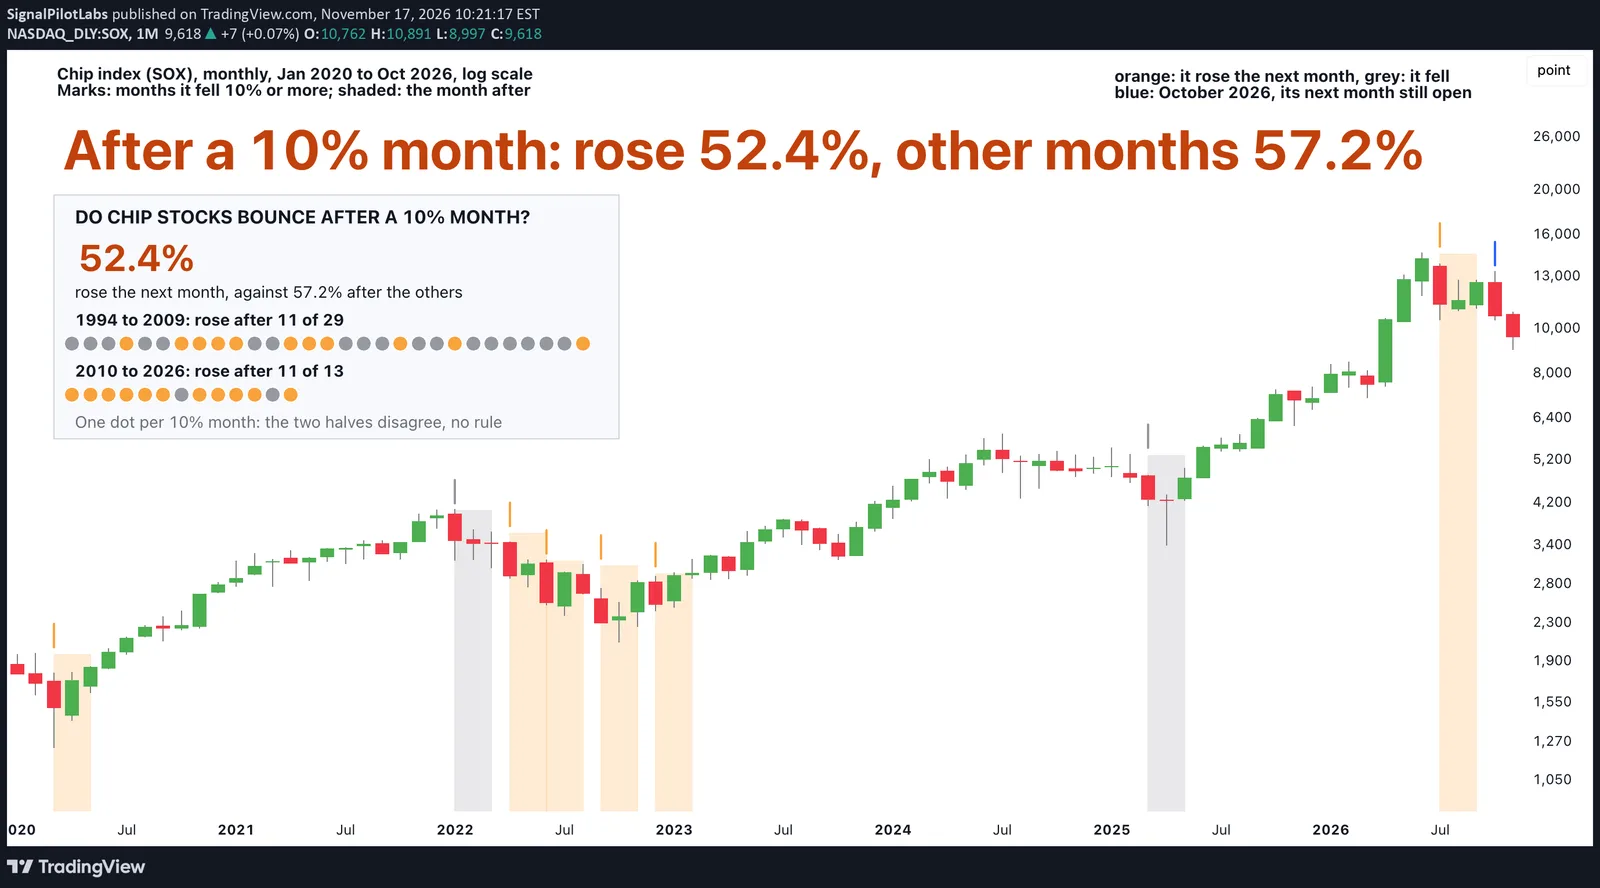
After a 10% month, the index rose the next month 52.4% of the time (22 of 42), against 57.2% after the other months. Three months on it was higher 54.8% of the time (23 of 42), against 66.0%.
The typical next month was +1.34%, against +1.62% after the others. Three months on it was +1.21%, against +5.93%. So there was no bounce: if anything, a rise came a little less often.
| Test | After a 10% month, higher (%) | After the other months (%) | Random draws as low (of 10,000) |
|---|---|---|---|
| The next month | 52.4 (22 of 42) | 57.2 | 3,330 |
| Three months on | 54.8 (23 of 42) | 66.0 | 1,010 |
Could it be luck?
We drew 42 months at random, 10,000 times. For the next month, 3,330 draws had 22 rises or fewer. For three months on, 1,010 had 23 or fewer. The 10% months sit on the low side, but neither test meets the bar we set first, so there is no rule either way.
Two halves that disagree
We split the record before the run: 1994 to 2009 and 2010 to 2026. Before 2010 the index rose the month after only 11 of its 29 falls, 37.9%, against 53.2% after the other months of those years. The 2000 to 2002 bust alone holds 12 of the 43, and 2008 holds 5.
Since 2010 it rose after 11 of 13, 84.6%, against 60.6%. Three months on, the halves split the same way. So the record cannot say which half October 2026 belongs to.
The biggest falls
The deepest falls on record all came before 2010. July 2026 ranks tenth, and October 2026 the 16th of 389. After July the index rose 1.98% in August, and three months on it was 5.50% lower. October’s next month is still open.
| Month | Chip index that month (%) |
|---|---|
| September 2001 | -33.59 |
| November 2000 | -27.61 |
| September 2000 | -26.14 |
| February 2001 | -26.08 |
| August 1998 | -24.17 |
| July 2026 | -20.61 |
| October 2026 | -15.36 |
On the chart
The chip index monthly from January 2020 to October 2026, on a log scale, where the same percentage move takes the same height. A short mark sits over each 10% month, and the month after it is shaded: orange when the index rose, grey when it fell. October 2026’s mark is blue: its next month is still open. The box holds the whole record, one dot per 10% month since 1994, by half.
What to do with it
A 10% month in chips has not been a reliable bounce point: before 2010 the falls often kept going. Treat a bounce as about as likely as after any month, not more.
How to check it yourself
- Take the chip index’s monthly closes and mark each month it closed 10% or more lower.
- For each, see whether it closed higher the next month and three months later, and do the same after every other month.
- Compare the shares, then split the record in two and see whether both halves agree.
What this does not tell you
Why the index fell (each crash had its own story), single chip stocks, or how big the next move is. Monthly closes, past data.
Observations, not recommendations.
We’re Signal Pilot Labs. We build the Elite Seven, seven indicators for TradingView, and we post what we measure, including the parts that didn’t work.
See what we build at signalpilot.io.
Published as a TradingView Idea on SOX. View the chart on TradingView
Past measurement described after the fact. Nothing here is a recommendation or an indication of future results.