Published as a TradingView Idea on BTCUSD. View the chart on TradingView
Stock traders talk about the turn of the month. We checked whether Bitcoin’s first 3 days of a month move differently from the rest of the month, and whether 50 altcoins do too.
What we measured
Bitcoin’s daily closes on Bitstamp from February 2015 to September 2026, 140 whole months, in UTC. Each day’s move is its close against the day before. We compared the first 3 days of every month with days 4 to the end. To test luck, we picked 3 random days in every month, 10,000 times. For the 50 coins we used Bybit’s daily closes, from each coin’s first whole month (February 2024 at the earliest) to September 2026. We wrote the rules and the bar down before computing anything, including this: we only call it a pattern if Bitcoin passes the luck test, both halves agree, and the 50 coins pass too.
What we found
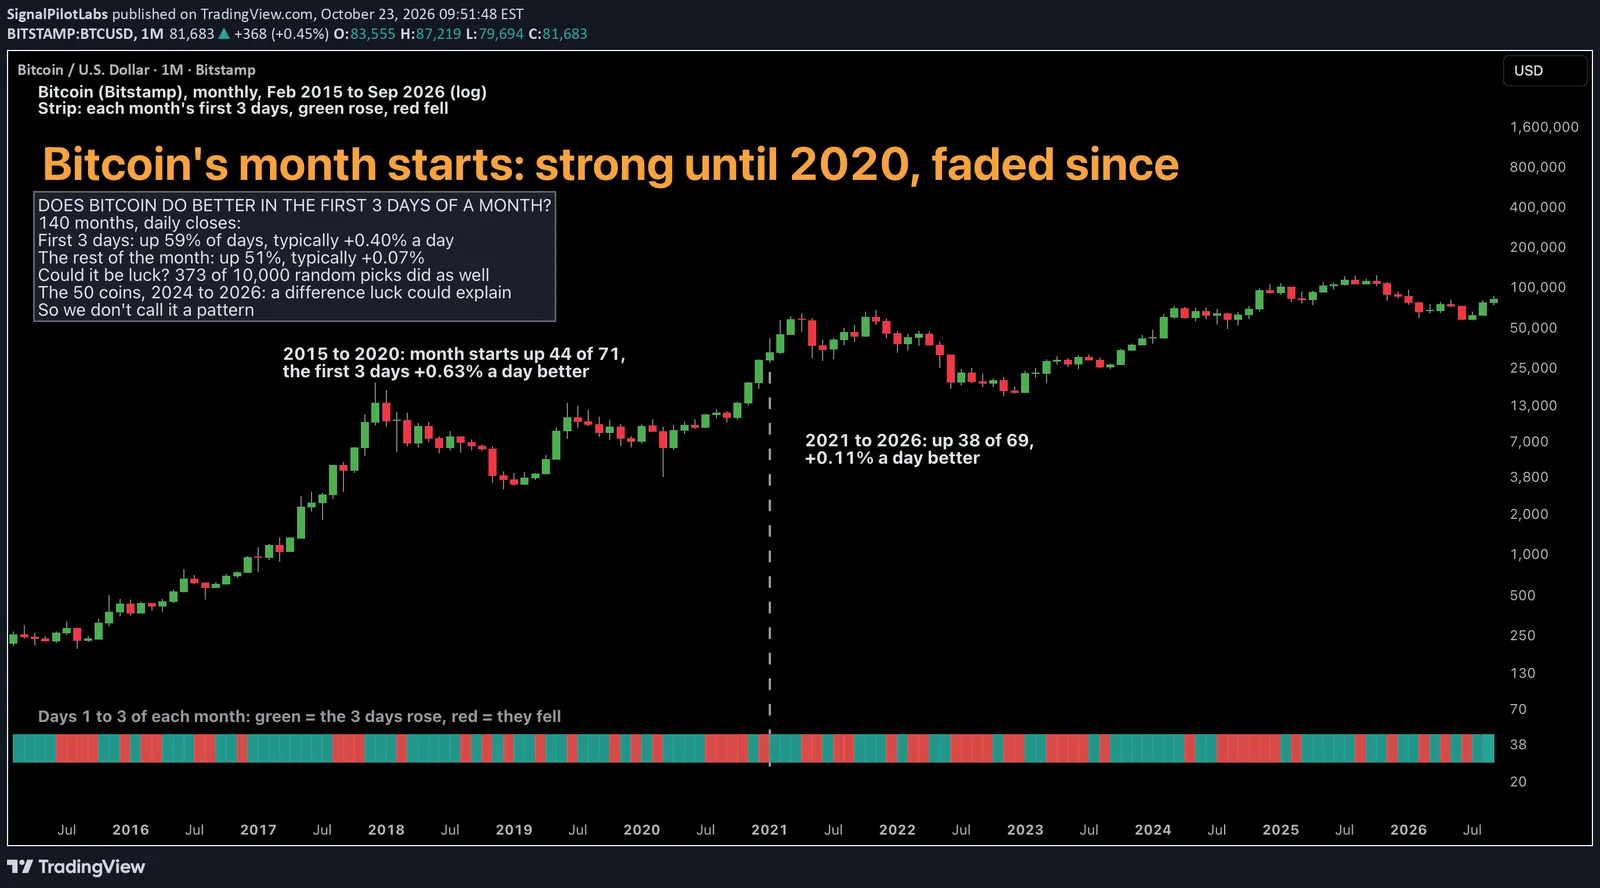
Bitcoin’s first 3 days rose on 59.0% of days, with a typical move of +0.40% a day. The rest of the month rose on 51.5%, typically +0.07%. Only 373 of the 10,000 random picks did as well, and 82 of the 140 months started with 3 days that added up to a gain.
| Bitcoin, 140 months | Days | Up (%) | Mean a day (%) | Typical a day (%) |
|---|---|---|---|---|
| First 3 days | 420 | 59.0 | +0.54 | +0.40 |
| Days 4 to the end | 3,840 | 51.5 | +0.16 | +0.07 |
But the effect lives mostly in the past. In 2015 to 2020 the first 3 days beat the rest by 0.63 points a day; from 2021 to 2026, by 0.11.
The 50 coins leaned the same way: 30 of them did better on the first 3 days, and all together they rose on 51.6% of those days against 47.5% of the rest. But 1,111 of 2,000 random picks did as well, a difference luck could explain. Bitcoin itself, measured on Bybit over the same months, averaged no better on its first 3 days.
So by the bar we set first, we don’t call it a pattern.
On the chart
Bitcoin monthly, February 2015 to September 2026, on a log scale. The strip under the candles marks each month’s first 3 days: green when they added up to a gain, red when to a loss. The dashed line marks January 2021: before it, 44 of 71 month starts rose; after it, 38 of 69.
What to do with it
If you’ve heard that crypto rallies at the start of the month, the long record agrees for Bitcoin, but the recent years don’t, and the altcoins don’t. A date on its own isn’t much of a reason to trade.
How to check a calendar effect yourself
- Split every month into the days you are testing and the rest, and compare the average daily move of each.
- Shuffle: pick the same number of random days in each month many times, and see how often chance matches your gap.
- Split the years in half. An effect that lives in one half only is history, not a habit.
What this does not tell you
Whether the old effect comes back. The coins’ window is short, 2.7 years, so it can miss a small effect. Past data.
Observations, not recommendations.
We’re Signal Pilot Labs. We build the Elite Seven, seven indicators for TradingView, and we post what we measure, including the parts that didn’t work.
See what we build at signalpilot.io.
Published as a TradingView Idea on BTCUSD. View the chart on TradingView
Past measurement described after the fact. Nothing here is a recommendation or an indication of future results.