Published as a TradingView Idea on BTC.D. View the chart on TradingView
Does a big week in Bitcoin dominance (Bitcoin’s share of the whole crypto market’s value) keep going? A big jump gets read as the end of an altcoin season, a big drop as the start of one. Inside one week, a jump simply is altcoins lagging Bitcoin. The real question is the week after.
What we measured
TradingView weekly closes of Bitcoin dominance, every week from January 2018 to 18 October 2026: 459 weeks. A big week moved 1 point or more, up or down. For each one we checked whether the next week moved the same way, and compared that with the weeks after an ordinary week. To test luck, we shuffled the order of the weeks 10,000 times. We set the bar before running anything: luck under 5%, and the same direction in both halves, 2018 to 2021 and 2022 to 2026.
What we found
| Big week | Weeks | Same way again the next week (%) | After ordinary weeks (%) | Shuffles as far, of 10,000 |
|---|---|---|---|---|
| Up 1 point or more | 78 | 47.4 | 57.1 | 9,330 |
| Down 1 point or more | 65 | 56.9 | 42.9 | 191 |
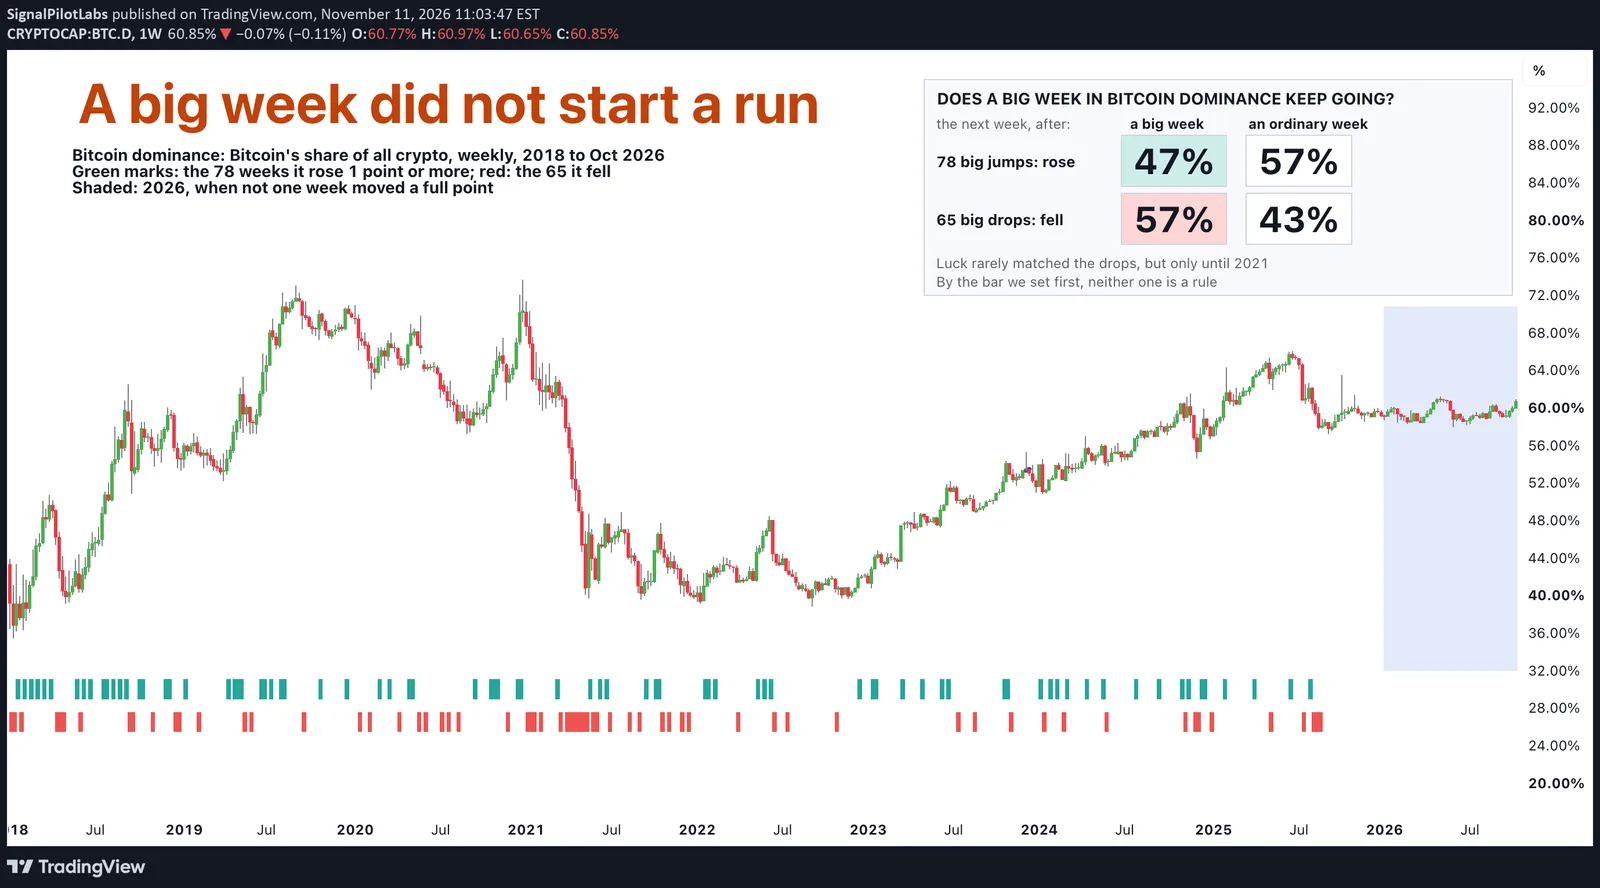
After 78 big jumps, dominance rose again the next week 47.4% of the time. After an ordinary week it rose 57.1% of the time. A jump did not start a run, and 9,330 of the 10,000 shuffles came as far: no pattern either way.
After 65 big drops, it fell again 56.9% of the time, against 42.9% after ordinary weeks. Only 191 of the shuffles came as far. But the halves split: from 2018 to 2021 a drop carried on 20.0 points more often than usual, and from 2022 on, 8.6 points less often. By the bar we set, that is no rule either.
The median next week (the middle one) was small in every case: -0.07 points after a big jump, -0.19 after a big drop, +0.09 after an ordinary week.
The calm of 2026
From January to mid-October 2026, dominance did not move a full point in any week: its weekly close stayed between 58.4% and 60.9%. The last big week was 18 to 24 August 2025, a drop of 1.47 points. 2018 had 30 big weeks, 2021 had 28 and 2025 had 9.
We had also planned to rank 50 large coins by how they did in the year’s big up weeks. The 52 weeks to 18 October 2026 held none, so there was nothing to rank.
On the chart
Bitcoin dominance, weekly, January 2018 to October 2026. Green marks under the candles show the 78 weeks it rose 1 point or more, red ones the 65 weeks it fell 1 point or more. They crowd 2018 and 2021 and stop after August 2025, and 2026 is shaded: not one week of it moved a full point.
How to check it yourself
- Open Bitcoin dominance on a weekly chart.
- Mark every week whose close moved 1 point or more from the week before.
- For each marked week, note whether the next week moved the same way, and compare that with the other weeks.
What to do with it
Don’t read one big dominance week as the start of an altcoin season, or the end of one. Since 2022 the next week has been close to a coin toss.
What this does not tell you
Which coins move in an altcoin season, or what dominance does over months. One measure of the market, weekly closes. Past data.
Observations, not recommendations.
We’re Signal Pilot Labs. We build the Elite Seven, seven indicators for TradingView, and we post what we measure, including the parts that didn’t work.
See what we build at signalpilot.io.
Published as a TradingView Idea on BTC.D. View the chart on TradingView
Past measurement described after the fact. Nothing here is a recommendation or an indication of future results.