Published as a TradingView Idea on MSFT. View the chart on TradingView
Seven stocks make up a big part of the Nasdaq 100. We measured how closely each one moved with the index from day to day, over the ten years 2016 to 2025.
What we measured
TradingView daily closes for the Nasdaq 100 and Apple, Microsoft, Nvidia, Amazon, Alphabet, Meta and Tesla (the stocks through TradingView’s BATS feed), on the 2,514 days all eight traded. For each stock: the correlation of its daily moves with the index’s, how much it moved per 1% of the index (beta), and the share of days both went the same way.
What we found
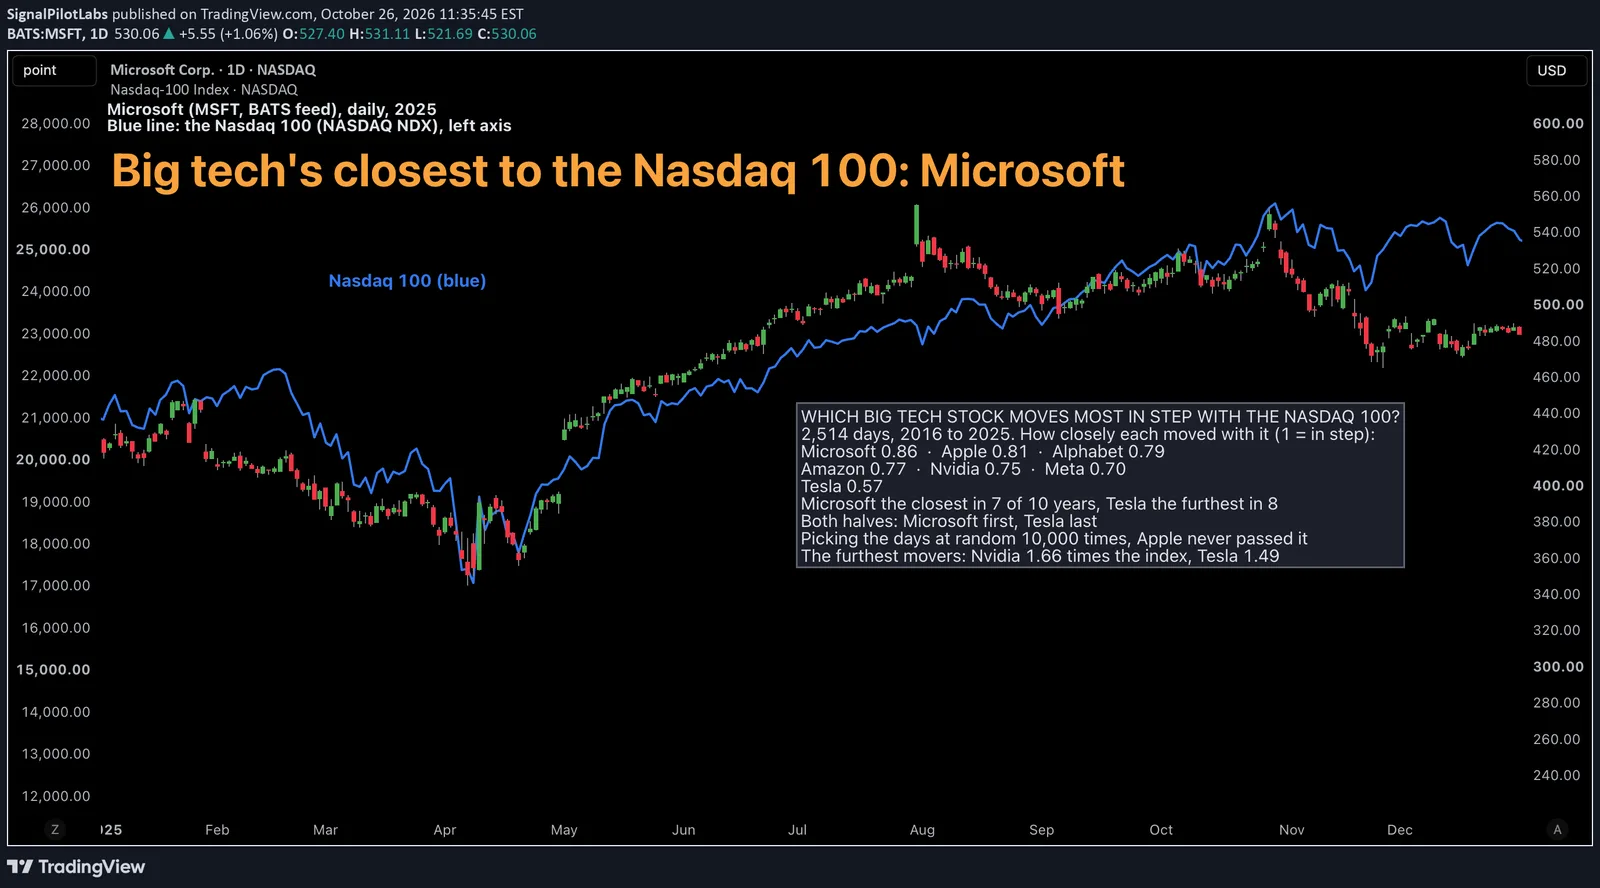
Microsoft tracked the Nasdaq 100 most closely: a correlation of 0.86, the same way on 81.5% of days, and about 1% for each 1% of the index. It was the closest of the seven in 7 of the 10 years.
Tesla tracked it least: 0.57, the same way on 68.3% of days. It was the furthest in 8 of the 10 years.
| Stock | Correlation with the Nasdaq 100 | Beta | Same way (%) | 2016 to 2020 | 2021 to 2025 | Closest / furthest of 10 years |
|---|---|---|---|---|---|---|
| Microsoft | 0.86 | 1.02 | 81.5 | 0.90 | 0.82 | 7 / 0 |
| Apple | 0.81 | 1.04 | 77.8 | 0.84 | 0.78 | 1 / 0 |
| Alphabet | 0.79 | 1.01 | 78.5 | 0.85 | 0.74 | 0 / 1 |
| Amazon | 0.77 | 1.12 | 78.1 | 0.76 | 0.77 | 0 / 0 |
| Nvidia | 0.75 | 1.66 | 77.7 | 0.70 | 0.79 | 1 / 1 |
| Meta | 0.70 | 1.20 | 75.3 | 0.73 | 0.69 | 1 / 0 |
| Tesla | 0.57 | 1.49 | 68.3 | 0.49 | 0.64 | 0 / 8 |
Is it luck?
Both halves agree on the ends: Microsoft first and Tesla last in 2016 to 2020 and again in 2021 to 2025. And in 10,000 resamples of the days, Apple, the second, never caught Microsoft. One thing moved: Nvidia went from sixth in the first half to second in the second, and in 2025 alone it was the closest of the seven.
What to do with it
If you watch one stock for the index’s daily direction, Microsoft was the closest. Nvidia moved the most per 1% of the index, 1.66%, and Tesla followed it least. Our post on how far big tech moves in a normal week found Tesla moving 8% in a normal week and Apple 4.5%.
On the chart
Microsoft, daily, 2025, with the Nasdaq 100 drawn over it in blue on its own scale (the left axis).
How to check a stock against its index yourself
- Take both daily closes over the same days and turn each into a daily change.
- Correlate the two series, and divide their covariance by the index’s variance for the beta.
- Repeat year by year. A stable leader stays near the top every year.
What this does not tell you
Which way the index or any of the seven goes next. A correlation is not a cause. Ten years, one data feed. Past data.
Observations, not recommendations.
We’re Signal Pilot Labs. We build the Elite Seven, seven indicators for TradingView, and we post what we measure, including the parts that didn’t work.
See what we build at signalpilot.io.
Published as a TradingView Idea on MSFT. View the chart on TradingView
Past measurement described after the fact. Nothing here is a recommendation or an indication of future results.