Published as a TradingView Idea on NDX. View the chart on TradingView
Do rising yields hurt tech stocks? A common market line says so. We tested it on 20 years of weeks: the US 10-year Treasury yield against the Nasdaq 100, January 2006 to October 2026.
What we measured
TradingView weekly closes for the 10-year yield (TVC:US10Y) and the Nasdaq 100, 1,085 weeks. A big week for the yield is one of the 10% largest rises, 14.9 basis points or more (a basis point is a hundredth of a percentage point), or the 10% largest falls, 13.7 or more. For each we took the Nasdaq’s move that week.
What we found
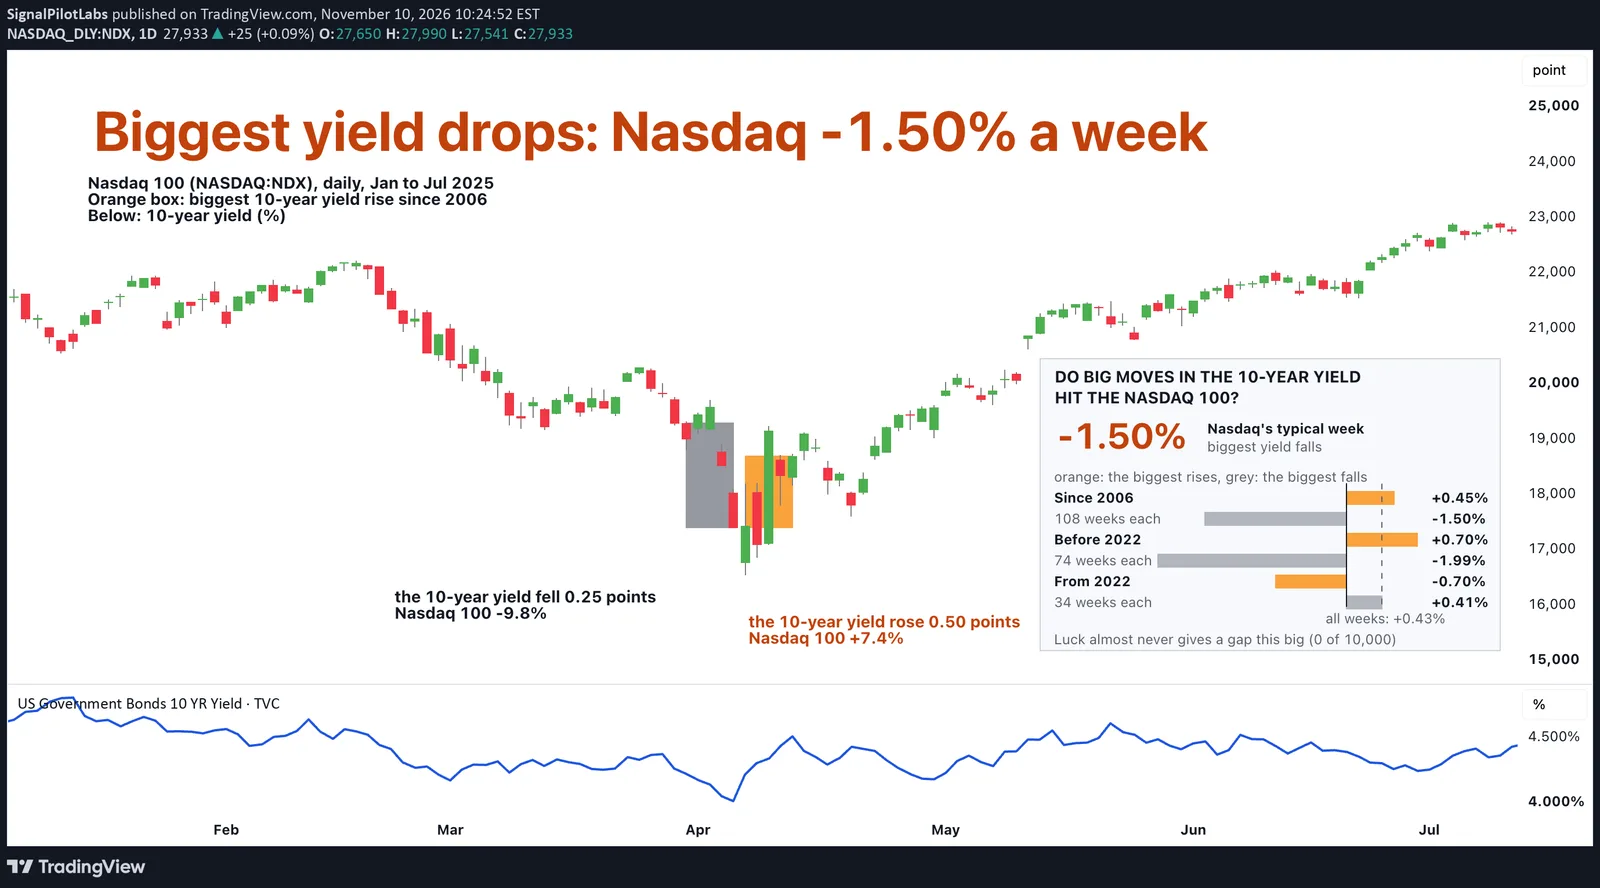
Over the whole record, the line had it backwards. In the yield’s biggest rises the Nasdaq’s median week (the middle one) was +0.45%, up in 56% of those weeks, close to an ordinary week at +0.43%. Its biggest falls were different: the median week lost 1.50%, up in only 34%. When yields dropped most, the Nasdaq fell with them.
The table gives the Nasdaq’s median week in each group, for the whole record and for the two periods.
| Weeks | 2006 to 2026 (%) | Before 2022 (%) | From 2022 (%) |
|---|---|---|---|
| The yield’s biggest rises | +0.45 | +0.70 | -0.70 |
| The yield’s biggest falls | -1.50 | -1.99 | +0.41 |
| All weeks | +0.43 | +0.46 | +0.34 |
Is it luck?
We shuffled the Nasdaq’s weeks against the yield’s 10,000 times. A gap as large as 1.95 points never came up.
Since 2022 it flipped
We split the record at 2022, the year the Fed began raising rates, before we ran it. Before 2022, the Nasdaq rose 0.70% in the yield’s biggest rises and lost 1.99% in its biggest falls, with a correlation (how closely the two moved together) of +0.31. From 2022 it was the other way round: -0.70% in the rises and +0.41% in the falls, a correlation of -0.13. The common line held in the rate-hike years, on 34 weeks each side, a small sample.
On the chart
This is the Nasdaq 100, daily, January to July 2025, with the 10-year yield as a blue line in the pane below. The orange box is the week the 10-year yield rose the most since 2006, 7 to 11 April 2025: +49.7 basis points, and the Nasdaq rose 7.4%. The grey box is the week before, also a big week: the yield fell 25.1 basis points and the Nasdaq lost 9.8%.
What to watch
The yield’s direction alone did not tell the Nasdaq’s. Before 2022 the Nasdaq fell in the big yield drops; since 2022, in the big yield rises. Check which one the market is in. Our post on big tech against the Nasdaq 100 measured the Nasdaq from another side: Microsoft tracked it most, Tesla least.
How to check it yourself
- Take weekly closes for the 10-year yield and the index, the same weeks.
- Mark the weeks with the largest yield rises and falls, and note the index’s move in each.
- Split the record where you think the regime changed, and shuffle the weeks to see how often chance gives the same gap.
What this does not tell you
What the next big week will do. Two decades, two regimes, and the newer one rests on few weeks. Past data.
Observations, not recommendations.
We’re Signal Pilot Labs. We build the Elite Seven, seven indicators for TradingView, and we post what we measure, including the parts that didn’t work.
See what we build at signalpilot.io.
Published as a TradingView Idea on NDX. View the chart on TradingView
Past measurement described after the fact. Nothing here is a recommendation or an indication of future results.