Published as a TradingView Idea on SPX. View the chart on TradingView
Americans vote in the midterm elections on Tuesday 3 November, and the line in every preview is that stocks rally afterwards. We checked every midterm since 1930, from the vote to New Year.
What we measured
The S&P 500’s daily closes from 1928 to 2025. For each year we took the last close before election day, the Tuesday after the first Monday of November, and the last close of the year, and asked how often the S&P 500 rose over those weeks in the 24 midterm years, against the same weeks of the other 74 years. We wrote the rules and the bar down before measuring a single year.
What we found
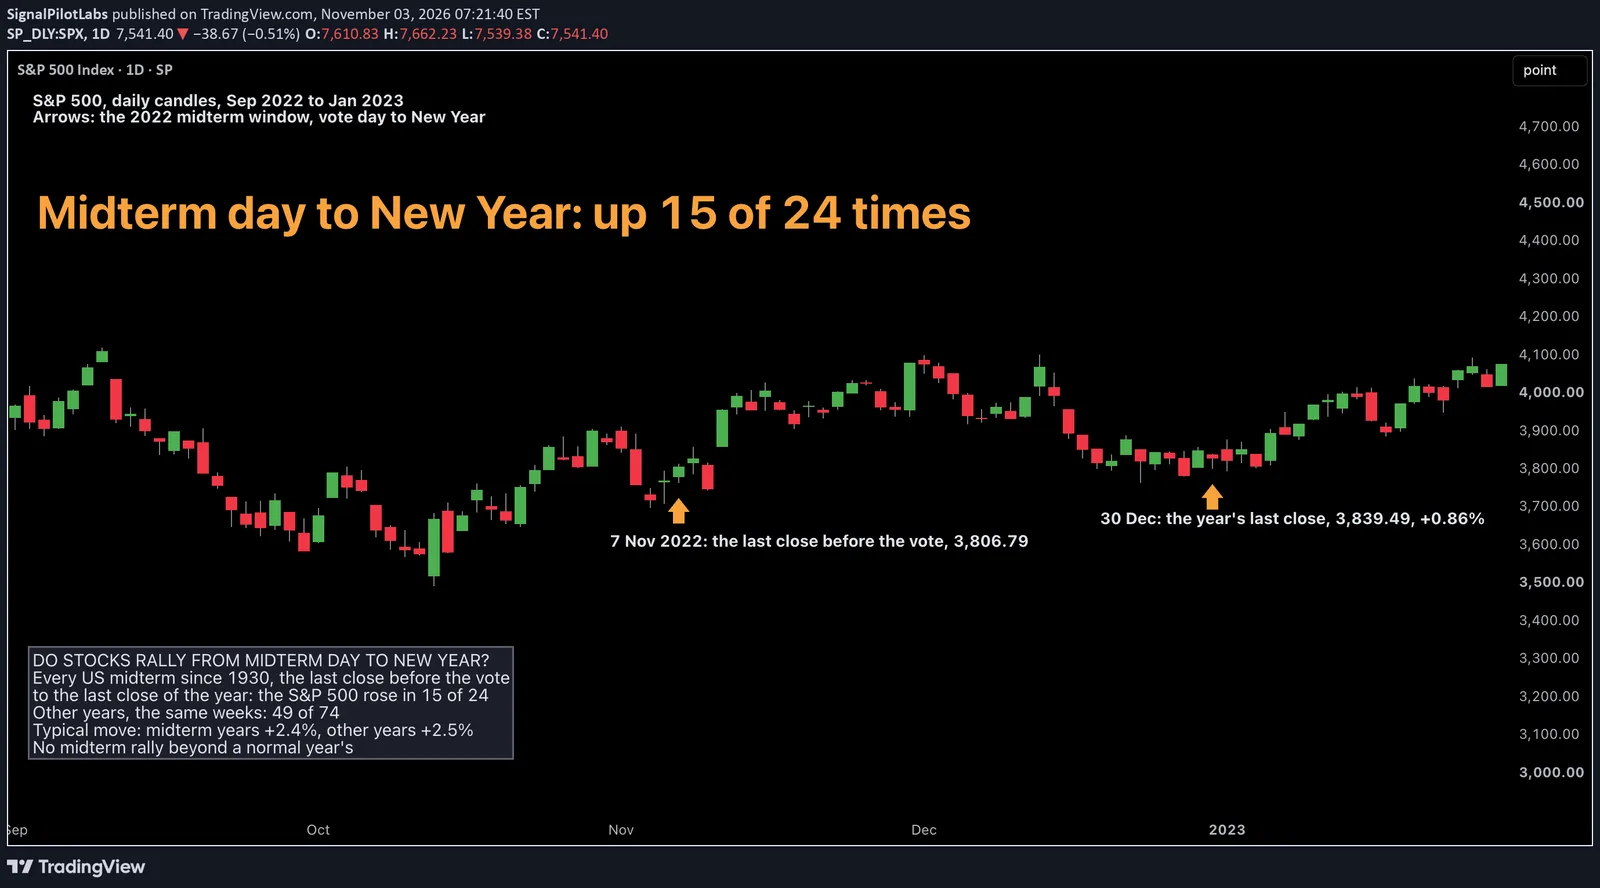
In the 24 midterm years the S&P 500 rose from the vote to New Year in 15, 62.5%. Over the same weeks of the other 74 years it rose in 49, 66.2%: presidential election years 68.0%, odd years 65.3%. Its typical move was +2.41% after a midterm and +2.47% in the other years. These are good weeks for stocks in most years; the midterms add nothing to them.
| Years | Counted | Rose to New Year (%) | Typical move (%) |
|---|---|---|---|
| Midterm years | 24 | 62.5 | +2.41 |
| Presidential election years | 25 | 68.0 | +2.47 |
| Odd years | 49 | 65.3 | +2.48 |
| All the other years | 74 | 66.2 | +2.47 |
Could it be luck?
We drew 24 years at random from the 98, 10,000 times. A count as low as 15 came up in 4,575 draws, so the gap is nothing unusual. The midterm share was the lower in both halves of the record: 58.3% against 59.5% to 1976, 66.7% against 73.0% since. By the bar we set first, there is no midterm rule.
The biggest windows
Described, not tested: the best midterm window was 1954, +13.18%; the worst was 1930, -10.45%. The last one, 2022, went from 3,806.79 on 7 November to 3,839.49 on 30 December, +0.86%. The S&P 500 fell over the window after 9 of the 24 midterms, most recently in 2018.
| Midterm year | Last close before the vote | Last close of the year | Change (%) |
|---|---|---|---|
| 1930 | 17.13 | 15.34 | -10.45 |
| 1934 | 9.02 | 9.50 | +5.32 |
| 1938 | 13.43 | 13.14 | -2.16 |
| 1942 | 9.48 | 9.77 | +3.06 |
| 1946 | 15.33 | 15.30 | -0.20 |
| 1950 | 19.36 | 20.43 | +5.53 |
| 1954 | 31.79 | 35.98 | +13.18 |
| 1958 | 51.56 | 55.21 | +7.08 |
| 1962 | 58.35 | 63.10 | +8.14 |
| 1966 | 80.73 | 80.33 | -0.50 |
| 1970 | 83.51 | 92.15 | +10.35 |
| 1974 | 73.08 | 68.56 | -6.19 |
| 1978 | 95.19 | 96.11 | +0.97 |
| 1982 | 135.46 | 140.64 | +3.82 |
| 1986 | 245.80 | 242.16 | -1.48 |
| 1990 | 314.59 | 330.22 | +4.97 |
| 1994 | 463.06 | 461.17 | -0.41 |
| 1998 | 1,111.60 | 1,229.23 | +10.58 |
| 2002 | 908.35 | 879.82 | -3.14 |
| 2006 | 1,379.78 | 1,418.30 | +2.79 |
| 2010 | 1,184.38 | 1,257.64 | +6.19 |
| 2014 | 2,017.81 | 2,058.90 | +2.04 |
| 2018 | 2,738.31 | 2,506.85 | -8.45 |
| 2022 | 3,806.79 | 3,839.49 | +0.86 |
On the chart
The S&P 500 daily from September 2022 to January 2023: an arrow under the last close before the 2022 vote and one under the last close of the year, orange because that window rose.
What to do with it
If you hold stocks into year end, the vote is not a reason on its own to expect more than a normal November and December, and not a reason to expect less. Our post on the S&P 500’s new highs counted the months it set a new record.
How to check it yourself
- Take the S&P 500’s daily closes and, for each year, mark the last close before election day and the last close of the year.
- See whether the S&P 500 rose between the two, and split the years into midterm, presidential and odd years.
- Compare the shares, then check the same comparison in each half of the record.
What this does not tell you
How a given result, a split Congress or a clean sweep, played out, or what the S&P 500 will do after this vote. Daily closes, past data.
Observations, not recommendations.
We’re Signal Pilot Labs. We build the Elite Seven, seven indicators for TradingView, and we post what we measure, including the parts that didn’t work.
See what we build at signalpilot.io.
Published as a TradingView Idea on SPX. View the chart on TradingView
Past measurement described after the fact. Nothing here is a recommendation or an indication of future results.