Published as a TradingView Idea on SPX. View the chart on TradingView
Is $100 oil bad for stocks? WTI crude is back over $100: its October value in FRED, the St Louis Fed’s database, is 103.37. We checked every month since 1986.
What we measured
Monthly WTI crude (FRED:DCOILWTICO) and the S&P 500’s monthly closes (SP:SPX), January 1986 to September 2026: 489 months. WTI closed at $100 or more in 30 of them, in eight runs. For each we asked whether the S&P 500 fell that month and the month after, against all the other months. Both tests, and the bar they had to clear, were written down before a single month was paired.
What we found
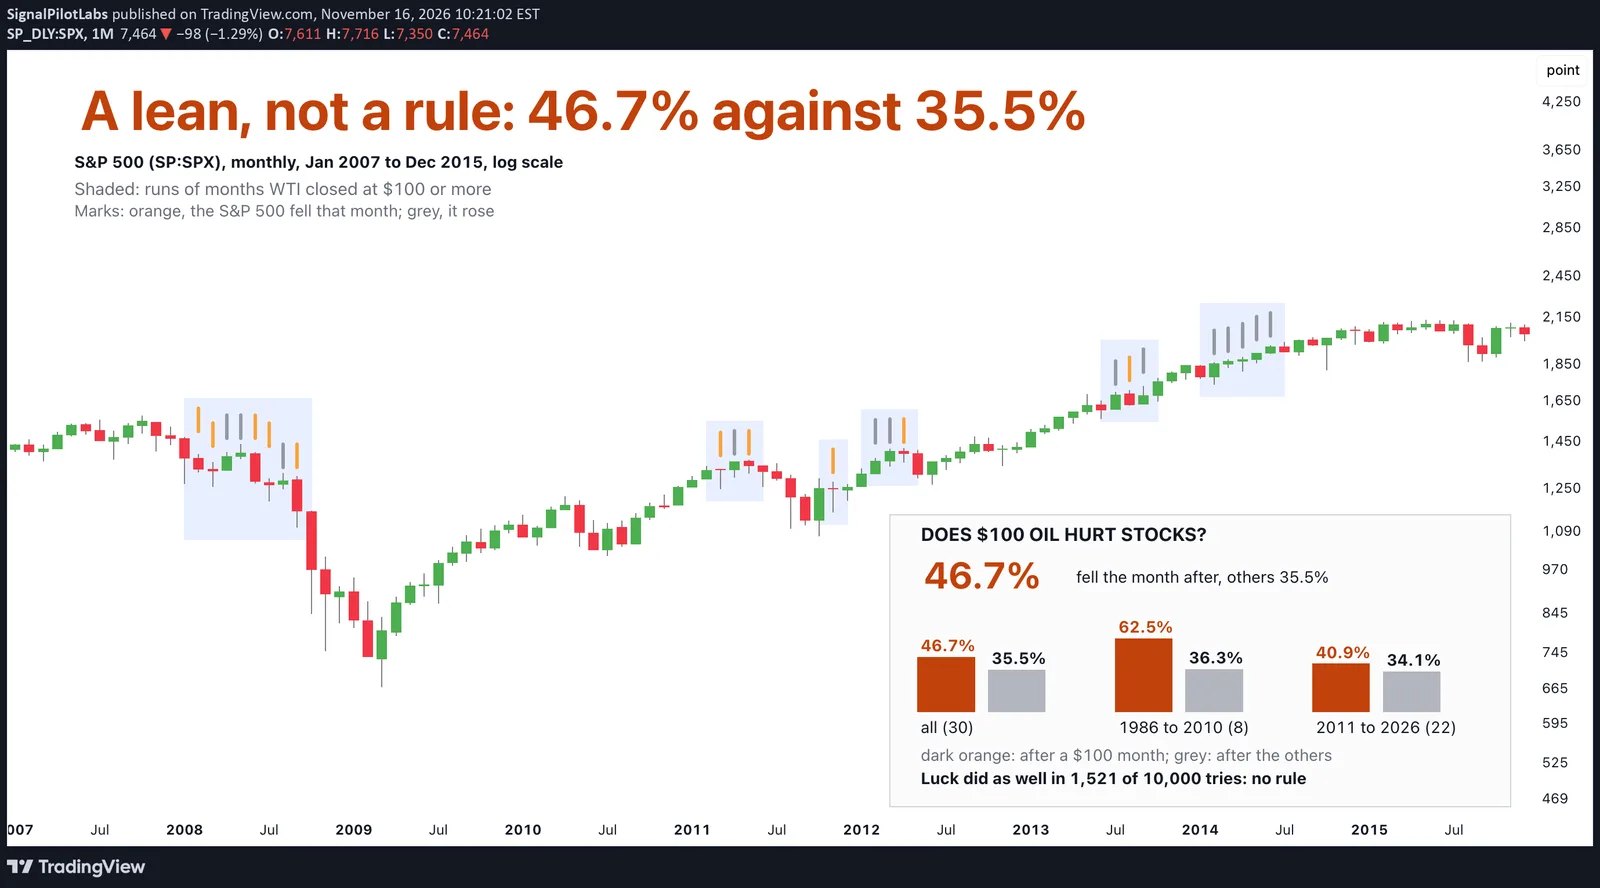
In the month after a $100 oil month, the S&P 500 fell 46.7% of the time (14 of 30). After the other months it fell 35.5%. The typical month after was +0.31%, against +1.31% after the others.
In the $100 oil month itself it fell 43.3% of the time, against 35.5%. The typical month: +0.66%, against +1.26%.
| Test | $100 oil months, S&P 500 down (%) | Other months (%) | Luck did as well (of 10,000) |
|---|---|---|---|
| The month after a $100 oil month | 46.7 (14 of 30) | 35.5 | 1,521 |
| The $100 oil month itself | 43.3 (13 of 30) | 35.5 | 2,526 |
Could it be luck?
Both halves lean the same way for the month after: 62.5% against 36.3% from 1986 to 2010, and 40.9% against 34.1% from 2011 to 2026. But 30 months in eight runs is a small record. When we drew 30 months at random, 10,000 times, 1,521 draws held 14 falls or more. That misses the bar we set first. A lean, not a rule.
The runs
Oil sat at $100 or more from February to September 2008 (8 months), March to May 2011 (3), November 2011 (1), February to April 2012 (3), July to September 2013 (3), February to June 2014 (5), March to July 2022 (5) and March to April 2026 (2). The record ends with September 2026. October’s 103.37 came after it, and the S&P 500 fell 0.93% that month.
| Month | WTI ($) | S&P 500 that month (%) | S&P 500 the month after (%) |
|---|---|---|---|
| March 2026 | 102.86 | -5.09 | +10.42 |
| April 2026 | 108.64 | +10.42 | +5.15 |
On the chart
The S&P 500 monthly from January 2007 to December 2015, on a log scale (equal steps up the scale are equal percentage moves). Each run of months WTI closed at $100 or more is shaded, with a short mark over each month: orange when the S&P 500 fell that month, grey when it rose. 10 of the 23 here are orange. We first drew 2007 to 2026, but its 238 candles came out too thin to read, so the chart shows 2007 to 2015, a change made after the test and for the picture only.
What to do with it
$100 oil has come with weaker months for stocks more often than not, but on 30 months the record cannot tell that from luck. Treat it as a lean to watch, not a reason to sell. Our post on airline stocks when oil jumps looks at the stocks that pay for fuel.
How to check it yourself
- Take WTI crude month by month and the S&P 500’s monthly closes, and mark each month WTI closed at $100 or more.
- For each, see whether the S&P 500 closed the next month lower, and do the same after every other month.
- Compare the shares, then in each half of the record, and see how often random months do as well.
What this does not tell you
Why oil was high (2008, 2014 and 2022 were very different years), other oil levels, or other markets. Monthly closes, past data.
Observations, not recommendations.
We’re Signal Pilot Labs. We build the Elite Seven, seven indicators for TradingView, and we post what we measure, including the parts that didn’t work.
See what we build at signalpilot.io.
Published as a TradingView Idea on SPX. View the chart on TradingView
Past measurement described after the fact. Nothing here is a recommendation or an indication of future results.