Published as a TradingView Idea on SHELLUSDT. View the chart on TradingView
SHELL more than doubled in one Friday, while Bitcoin fell 12.7% over the week. It was the biggest move of any market we scan, from crypto and gold to oil, forex and stocks, all on Bybit. Here is that week, from 9 to 15 November 2026, on its Bybit perpetual, SHELLUSDT, in UTC. We read no news and claim no cause.
What we measured
Bybit’s public 4-hour candles for the whole week, Monday to Monday in UTC: the week’s low before the top, the highest 4-hour close, the highest price touched and the last close. Under the top, the 240 one-minute candles of the 4 hours after it. Then the perpetual’s daily trading, its open positions hour by hour and every funding settlement. We wrote these questions down before reading any of that data.
The run
| Point | Date | Price |
|---|---|---|
| The week’s low | 13 Nov 2026 | 0.01859 |
| The highest 4-hour close | 13 Nov 2026 | 0.04000 |
| The top of the week | 13 Nov 2026 | 0.05042 |
| The week’s last close | 15 Nov 2026 | 0.02771 |
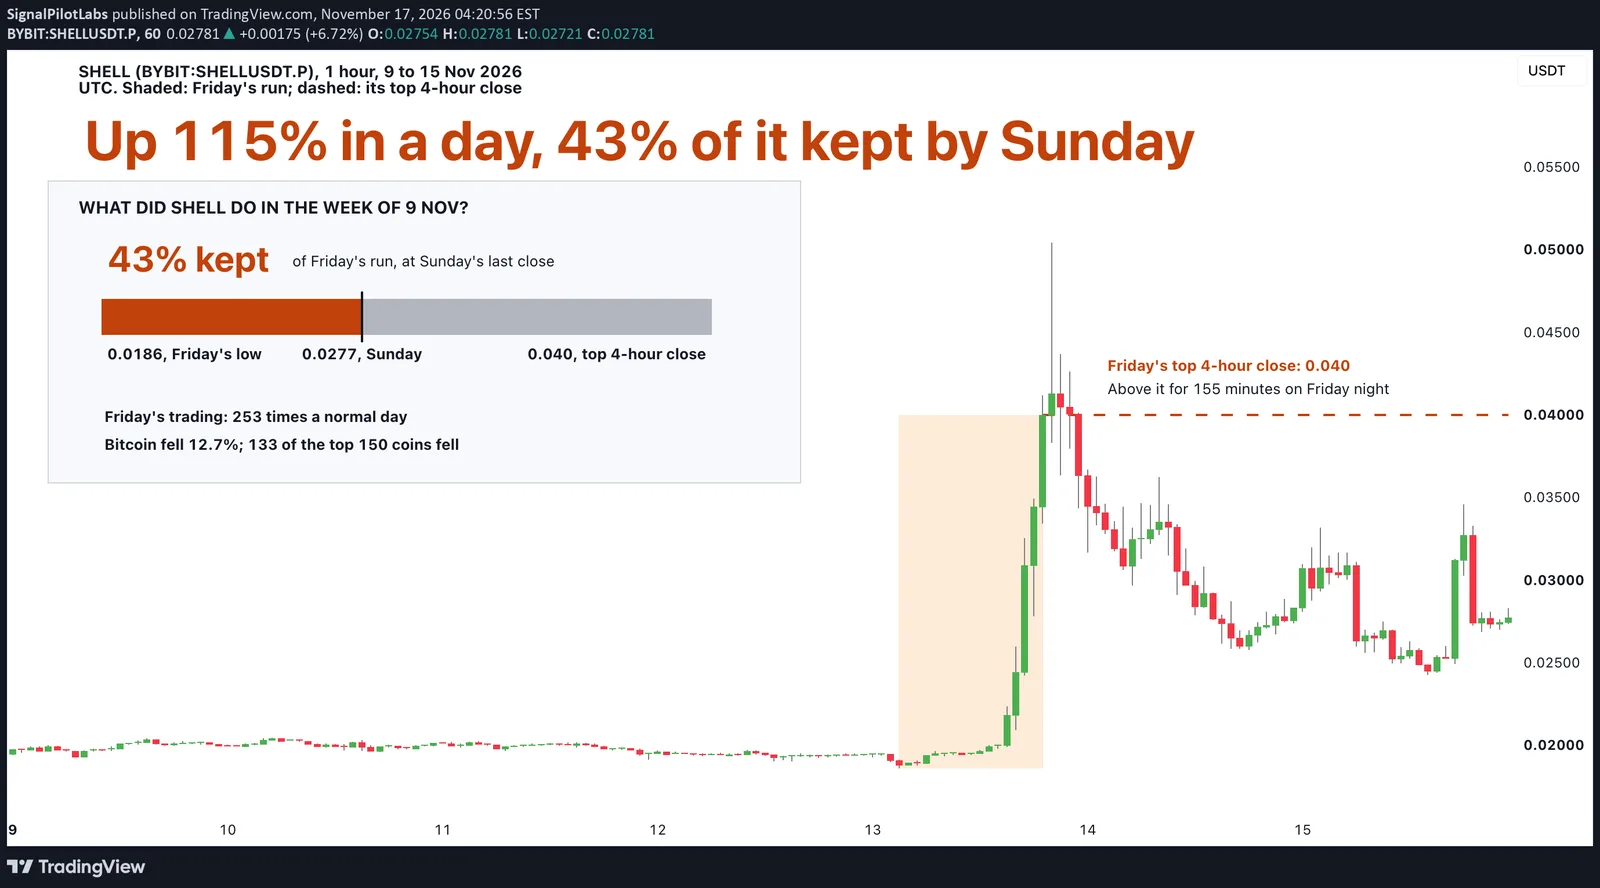
For four days SHELL sat near 0.019 to 0.020. On Friday 13 November it dipped to 0.0186, then climbed from mid-afternoon. Its top 4-hour close came at 20:00: 0.040, up 115% on that low in one day. By Sunday’s last close it stood at 0.0277, 31% below Friday’s top close. It still ended the week up 42%, with 43% of the run kept.
Split the week in half and the halves could not differ more. From Monday to Thursday noon SHELL moved 0.3%. From Thursday noon to Sunday night it rose 42%, nearly all of the week’s gain.
The top
In the next 4 hours SHELL touched 0.0504, its high of the week. Minute by minute, it traded above 0.040, the top close, on 155 of those 240 minutes, and closed above it on 132. About 13.1 million USDT of the candle’s 17.1 million changed hands in those minutes, 77%. So the top was hours of trading, not one stray print. Bybit lists no SHELL spot market to compare it with.
Who paid
In the 30 days before the week, the perpetual traded a typical 112,000 USDT a day. On Friday it traded 28.3 million, about 253 times that, and on Saturday 27.0 million. The whole week came to about 9 times the whole month before it.
Funding came every 4 hours, at the ordinary 0.005% on 29 of the 42 settlements. It rose to about 0.05% on Thursday night and Friday morning, before the run, with longs paying shorts. From Saturday morning it turned negative, shorts paying longs, as low as -0.136% in Sunday’s last settlement: 8 of the 42 were negative.
Open positions were worth 0.27 million USDT at the start of the week. They climbed with Friday’s run to a peak of 2.06 million at 21:00 that night, almost eight times the start. By the end of the week, late on Sunday, with funding negative since Saturday morning, they stood at 1.64 million.
Alone?
No, but nearly. Of the 150 crypto perpetuals most traded on Bybit the week before, three had a 4-hour close more than double the week’s open: AKE, INIT and EVAA. Two ended the week up more than 100%, EVAA by 143% and AKE by 121%. The other side was much bigger: 133 of the 150 fell, the typical one by 11.8%. Bitcoin fell 12.7% and Ether 13.7%.
Its own past
Bybit listed SHELL’s perpetual on 17 February 2025, and its first daily close was 0.3906. Its highest daily close, 0.5997, came ten days later. Friday’s top close sat 93% below that. Sunday’s last close was 95% below it, and 93% below the first close.
On the chart
SHELL, 1-hour candles from 9 to 15 November 2026. Friday’s run is shaded from its low to its top 4-hour close, and the top close is the dashed line, with the minutes it traded above it. The board shows how much of the run was kept at Sunday’s last close: 43%.
How to read a move like this yourself
- Look past the top wick: find the highest candle close and measure the run to that.
- Ask how much of the run is still held at the end.
- Open the 1-minute candles under the top: one print, or hours of trading?
- Read funding and open positions on the way up and on the way down. They show who paid to hold, not why the price moved.
Our read of IRYS’s week runs the same checks on another coin: its spike lasted half an hour, SHELL’s top lasted hours.
What this does not tell you
Why SHELL moved, or what it does next. One week, one coin, one exchange, so a single case like this cannot be told apart from noise. Past data.
Observations, not recommendations.
We’re Signal Pilot Labs. We build the Elite Seven, seven indicators for TradingView, and we post what we measure, including the parts that didn’t work.
See what we build at signalpilot.io.
Published as a TradingView Idea on SHELLUSDT. View the chart on TradingView
Past measurement described after the fact. Nothing here is a recommendation or an indication of future results.