Published as a TradingView Idea on RUT. View the chart on TradingView
Small caps are said to move more than large caps, both ways. We measured the Russell 2000 against the S&P 500 week by week, from 1988 to 2025.
What we measured
TradingView weekly closes for the Russell 2000 and the S&P 500: 1,983 weeks. Both are price indices, without dividends, and the S&P’s companies pay more of them.
What we found
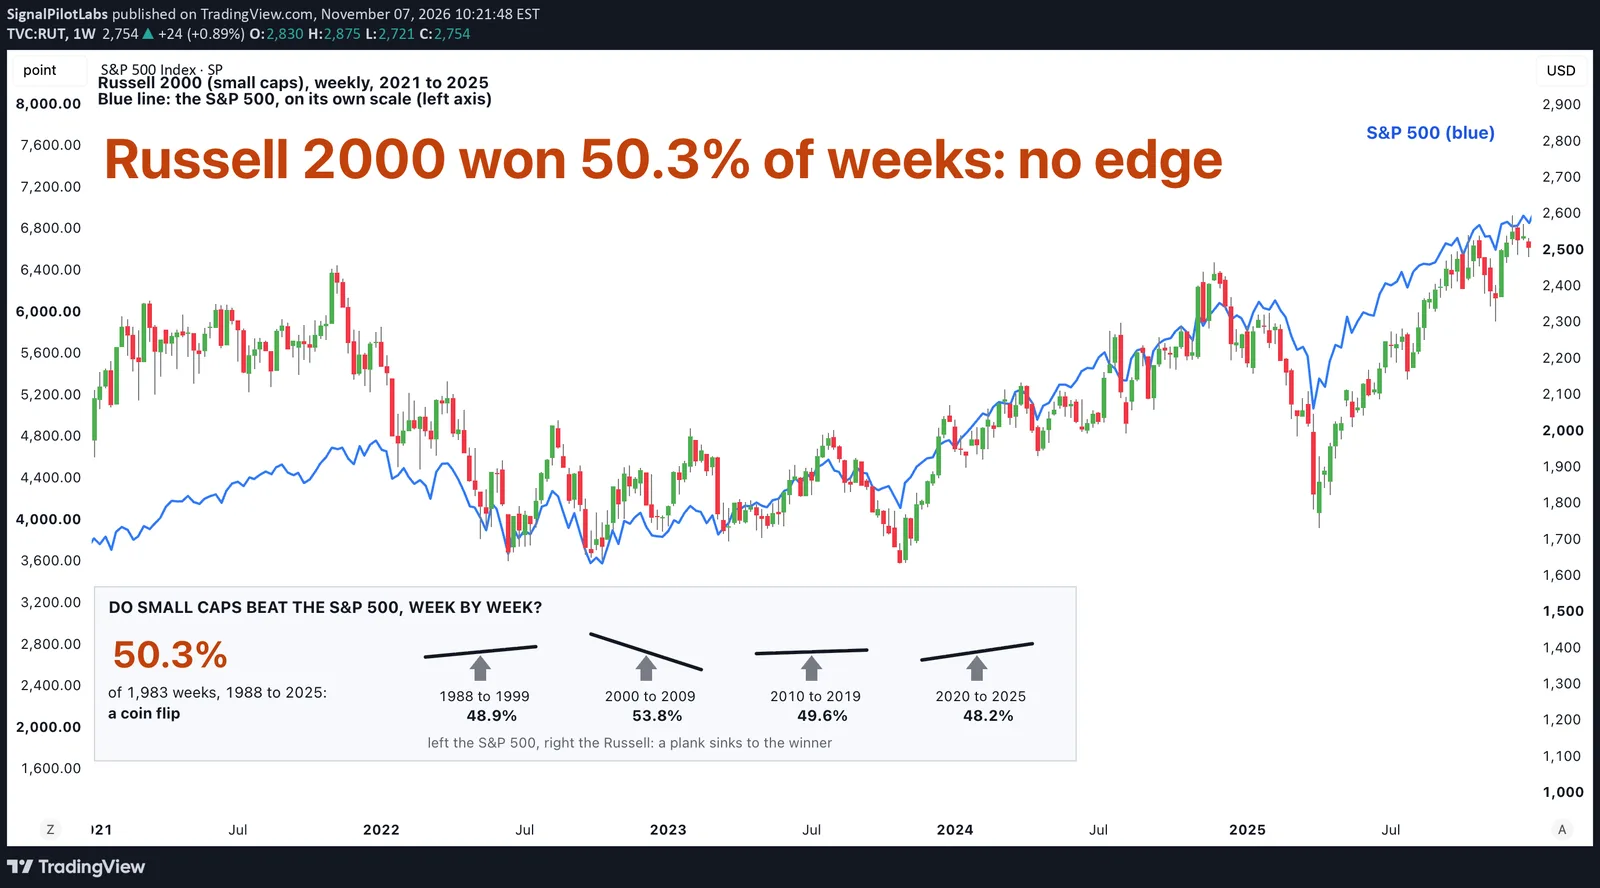
Week to week it is a coin flip: the Russell beat the S&P in 50.3% of weeks, and every decade landed between 48% and 54%.
How far it moves changed. Before 2007 the Russell moved 0.88% for each 1% of the S&P; since 2007, 1.17%. On the S&P’s weeks down more than 3% since 2007, the Russell fell further in 52 of 79, typically 1.26 times as far (the median, the middle case). Before 2007: 26 of 51.
Over the 38 years the S&P rose more on price: +2,676% against +1,983% for the Russell. The Russell won the 2000s, +23.9% against -24.1%, and lost every other decade.
| Period | Weeks the Russell beat the S&P (%) | Russell per 1% of the S&P | Russell price change (%) | S&P price change (%) |
|---|---|---|---|---|
| 1988 to 1999 | 48.9 | 0.73 | +319.2 | +494.6 |
| 2000 to 2009 | 53.8 | 1.11 | +23.9 | -24.1 |
| 2010 to 2019 | 49.6 | 1.20 | +165.6 | +190.1 |
| 2020 to 2025 | 48.2 | 1.17 | +51.0 | +112.0 |
| 1988 to 2006 | 51.6 | 0.88 | +554.1 | +474.0 |
| 2007 to 2025 | 49.0 | 1.17 | +218.4 | +383.6 |
Did it hold?
The coin flip held in both halves: 51.6% from 1988 to 2006, 49.0% from 2007 to 2025. The bigger moves since 2007 are a change between the halves, not something that held in both.
What to do with it
Do not expect small caps to win more weeks than large caps. Since 2007, expect them to move further on the S&P’s bad weeks, and size for it. Our post on the worst week of each year measured the S&P 500, the Nasdaq and the Russell 2000: a median -4.6% for the S&P since 1988.
On the chart
The Russell 2000, weekly, 2021 to 2025, with the S&P 500 drawn over it in blue on its own scale: read it on the left axis. Under the candles, each decade is a seesaw that sinks toward the side that won more weeks. All four sit close to level.
How to compare two indices yourself
- Take both indices’ weekly closes and count the weeks one rose more than the other.
- Measure how far one moves for each 1% of the other, before and after a split date.
- Look at the big weeks separately: they are where the size shows.
What this does not tell you
Which will lead next, or whether the bigger moves since 2007 will last. Past data.
Observations, not recommendations.
We’re Signal Pilot Labs. We build the Elite Seven, seven indicators for TradingView, and we post what we measure, including the parts that didn’t work.
See what we build at signalpilot.io.
Published as a TradingView Idea on RUT. View the chart on TradingView
Past measurement described after the fact. Nothing here is a recommendation or an indication of future results.