Published as a TradingView Idea on INTC. View the chart on TradingView
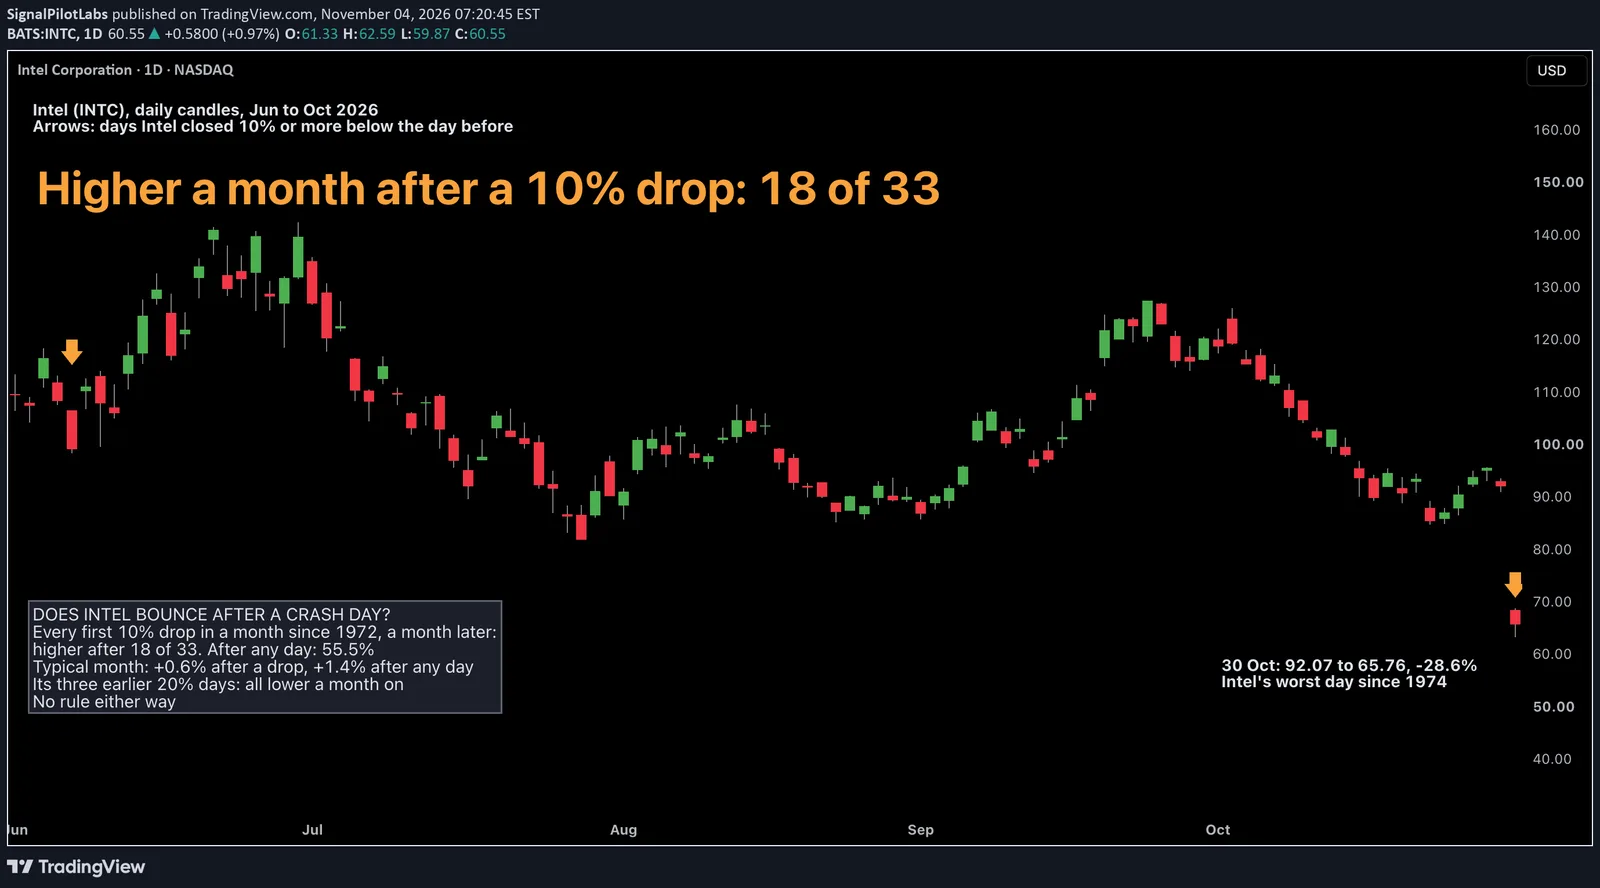
Intel closed at 92.07 on 29 October and at 65.76 on 30 October, down 28.6% in one day, its worst day since July 1974. After a day like that, does it bounce? We checked every 10% drop in Intel’s record.
What we measured
Intel’s daily closes from November 1972 to October 2026. A drop day is a close 10% or more below the day before; when drops came in a cluster we kept only the first in a month (21 trading days). For each drop day we took the close 21 trading days later and asked how often it was higher, against every day of the record. We wrote the rules and the bar down before measuring a single day.
What we found
After its 33 earlier 10% drop days, Intel was higher a month later in 18, 54.5%. After any day it was higher a month later 55.5% of the time. Its typical month after a drop was +0.57%, against +1.43% after any day. A crash day has not told you which way the next month goes.
| Day | Counted | Higher a month later (%) | Typical month after (%) |
|---|---|---|---|
| After a 10% drop day | 33 | 54.5 | +0.57 |
| After any day | 13,567 | 55.5 | +1.43 |
Could it be luck?
We drew 33 days at random from the record, 10,000 times. A count as low as 18 came up in 5,128 draws, so the gap is nothing unusual. The halves split: to 1999 Intel was higher after 11 of 16 drops, 68.75%, against 57.0% of all days; since 1999, after 7 of 17, 41.2%, against 54.0%. By the bar we set first, there is no rule either way.
The biggest days
Described, not tested: Intel’s three earlier drops of 20% or more, 3 September 1974 (-23.33%), 22 September 2000 (-22.03%) and 2 August 2024 (-26.06%), were all lower a month on: -23.91%, -9.65% and -6.42%. After 19 October 1987 (-19.23%) it fell another 20.54%. The only worse day in the file is 5 July 1974, -29.92%, inside an earlier cluster. The month after 30 October is not complete.
| Drop day | Drop (%) | A month later (%) |
|---|---|---|
| 1973-03-21 | -10.00 | +28.70 |
| 1973-04-25 | -11.59 | +9.84 |
| 1973-11-14 | -10.29 | -16.56 |
| 1974-06-17 | -15.11 | -23.73 |
| 1974-09-03 | -23.33 | -23.91 |
| 1980-10-30 | -10.38 | +4.88 |
| 1981-02-25 | -10.07 | +8.96 |
| 1987-10-19 | -19.23 | -20.54 |
| 1988-11-22 | -12.97 | +10.56 |
| 1991-03-11 | -11.17 | +3.83 |
| 1991-09-13 | -13.57 | -0.58 |
| 1992-04-10 | -10.70 | +0.98 |
| 1993-04-19 | -11.14 | +3.58 |
| 1995-07-19 | -10.92 | +0.57 |
| 1996-01-17 | -10.31 | +15.00 |
| 1998-03-05 | -12.58 | +1.57 |
| 2000-09-22 | -22.03 | -9.65 |
| 2001-03-09 | -11.47 | -21.19 |
| 2002-06-07 | -18.52 | -18.36 |
| 2002-10-16 | -18.04 | +41.88 |
| 2004-07-14 | -10.56 | -9.15 |
| 2006-01-18 | -11.45 | -5.53 |
| 2008-01-16 | -12.38 | +1.16 |
| 2008-09-29 | -10.05 | -8.16 |
| 2020-03-12 | -11.85 | +28.90 |
| 2020-07-24 | -16.24 | -2.87 |
| 2020-10-23 | -10.58 | -4.44 |
| 2021-10-22 | -11.68 | +0.75 |
| 2024-01-26 | -11.91 | -2.11 |
| 2024-08-02 | -26.06 | -6.42 |
| 2025-04-04 | -11.50 | +0.45 |
| 2026-01-23 | -17.03 | +2.33 |
| 2026-06-05 | -11.28 | +11.16 |
On the chart
Intel daily from June to October 2026, with an arrow over each 10% drop day: 5 June (-11.28%) and 30 October.
What to do with it
If you are tempted to buy Intel because it just fell 28.6%, the record says a crash day alone has not been a reason: a month later it was higher about as often as after any day, and the three biggest drops before this one kept falling. Our post on how far big tech moves in a normal week found Tesla moving 8% in a normal week and Apple 4.5%.
How to check it yourself
- Take a stock’s daily closes and mark the days it closed 10% or more below the day before, keeping only the first in any 21 trading days.
- For each, see whether the stock was higher 21 trading days later, and do the same for every day.
- Compare the shares, then check the same comparison in each half of the record.
What this does not tell you
Why each drop happened (earnings, guidance, the market), how the shares did over a year, or what Intel will do next. Daily closes, past data.
Observations, not recommendations.
We’re Signal Pilot Labs. We build the Elite Seven, seven indicators for TradingView, and we post what we measure, including the parts that didn’t work.
See what we build at signalpilot.io.
Published as a TradingView Idea on INTC. View the chart on TradingView
Past measurement described after the fact. Nothing here is a recommendation or an indication of future results.