Published as a TradingView Idea on XAUUSD. View the chart on TradingView
How many ounces of silver does an ounce of gold buy? That number, the gold to silver ratio, is one of the oldest ways to compare the two metals. We measured where it sits against the last five years of daily closes.
What we measured
TradingView’s OANDA gold and silver daily candles, matched day by day, back to February 2010: 4,313 days. The ratio is gold’s close divided by silver’s. The last five years are the 1,291 daily closes from 1 November 2021 to 30 October 2026. The rules were written down before the ratio was computed.
Where it sits
On 30 October 2026 an ounce of gold, at 3,875.65, bought 78.9 ounces of silver, at 49.13.
Over the five years the median was 83.4, and eight days in ten sat between 65.8 and 90.5. That 78.9 is lower than 70% of those days: gold bought less silver than it usually had.
Over the longer run it’s ordinary. Since 2010 the median is 74.6, and 64% of days had a lower ratio than 30 October’s.
| Gold to silver ratio | Last five years | Since 2010 |
|---|---|---|
| Days | 1291 | 4313 |
| Median | 83.4 | 74.6 |
| Lowest | 46.3 | 31.7 |
| Lowest, on | 27 Jan 2026 | 28 Apr 2011 |
| Highest | 104.8 | 124.0 |
| Highest, on | 21 Apr 2025 | 18 Mar 2020 |
| Days with a lower ratio than 30 October’s 78.9 (%) | 29.6 | 63.7 |
How far it moves
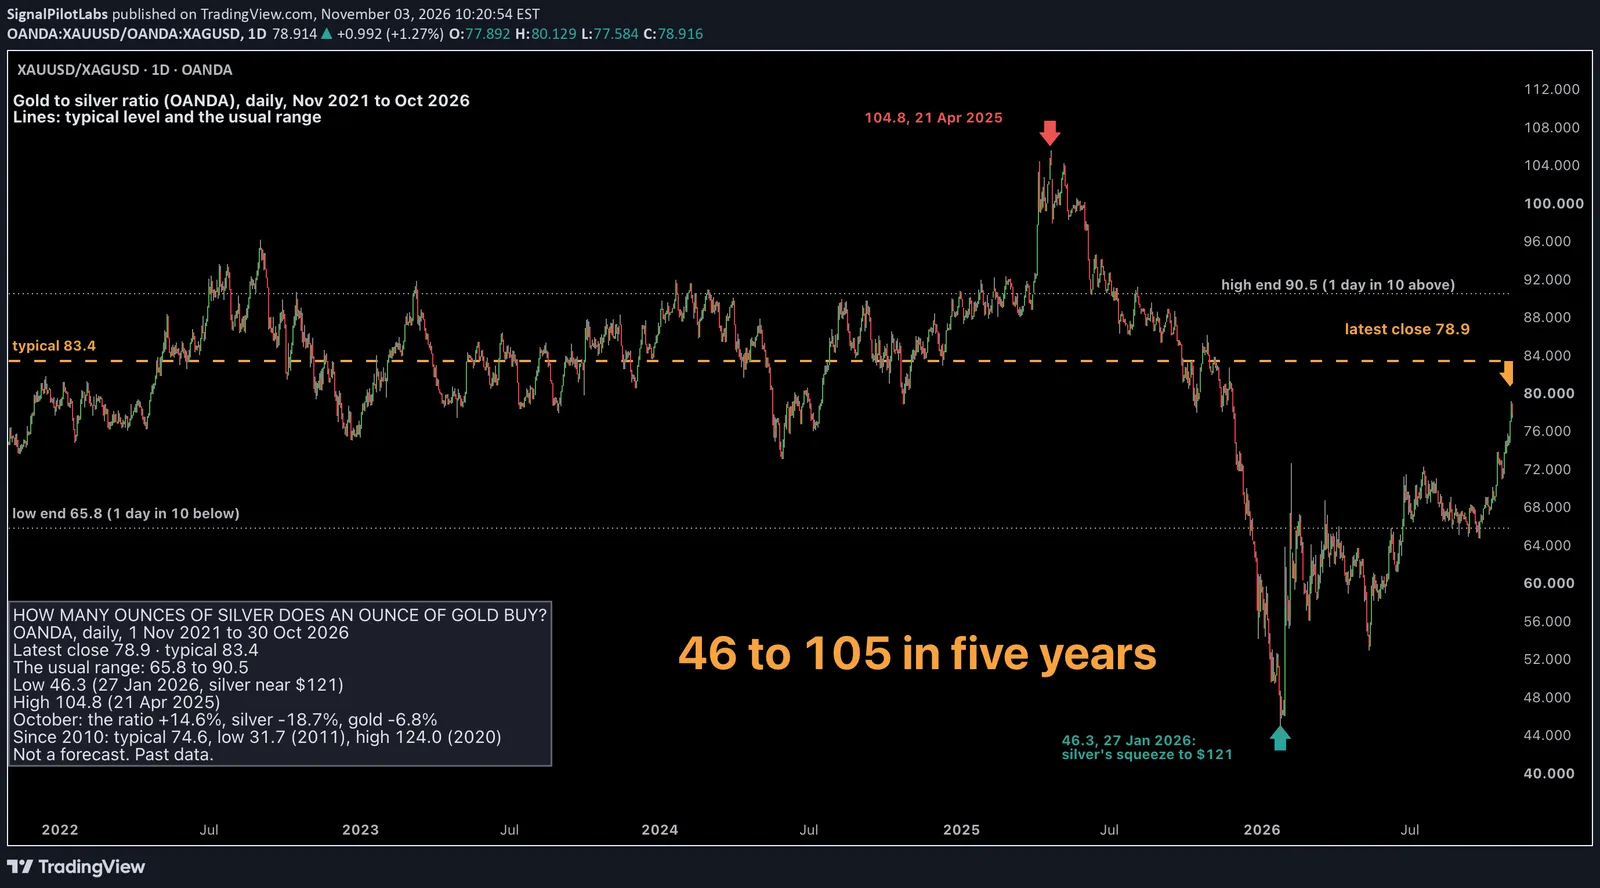
The five-year range was 46.3 to 104.8.
The high came on 21 April 2025, when gold ran ahead and silver lagged: in the week before, gold rose from 3,210.68 to 3,424.24 while silver stayed near 32.5.
The low came on 27 January 2026, in the middle of silver’s squeeze: silver closed at 111.91 that day and touched 121.67 two days later, its all-time high. On 30 January it closed 26% lower, at 85.19, and the ratio jumped back to 57.5.
Month to month, the ratio moved a median 3.9%. The biggest one-month fall was December 2025, down 19.3%. The biggest rise was October 2026, up 14.6%.
The last year
On 7 November 2025, 252 trading days earlier, the ratio was 82.8. Since then gold fell 3.1% and silver rose 1.7%, so the ratio fell 4.7% to 78.9. At the end of September it was down to 68.8; in October silver fell 18.7% and gold 6.8%, and the ratio took most of that back.
How far gold moves in a normal week, 5.1% at the median, is in our post on gold, silver and copper, with silver and copper beside it.
The chart
TradingView’s own ratio chart, OANDA:XAUUSD divided by OANDA:XAGUSD, daily, over the five years. The dashed orange line is the median, 83.4, and the dotted grey lines are the 10th and 90th percentiles, 65.8 and 90.5. The arrows mark the low, the high and 30 October’s 78.9.
How to read it
- A higher ratio means an ounce of gold buys more silver. A lower one means it buys less.
- Compare it with its own history, not a fixed number. Over these five years eight days in ten sat between 65.8 and 90.5.
- Check which metal moved. In October the ratio rose because silver fell almost three times as far as gold.
How far gold and silver move in a normal week is in our post on gold, silver and copper: gold 5%, silver 11%.
What this does not tell you
Where the ratio goes next. A low ratio doesn’t mean silver has to fall or gold has to rise, and the ratio has stayed far from its median for long stretches. It’s one way to see how the two metals have moved against each other. Past data.
Observations, not recommendations.
We’re Signal Pilot Labs. We build the Elite Seven, seven indicators for TradingView, and we post what we measure, including the parts that didn’t work.
See what we build at signalpilot.io.
Published as a TradingView Idea on XAUUSD. View the chart on TradingView
Past measurement described after the fact. Nothing here is a recommendation or an indication of future results.