Published as a TradingView Idea on XAUUSD. View the chart on TradingView
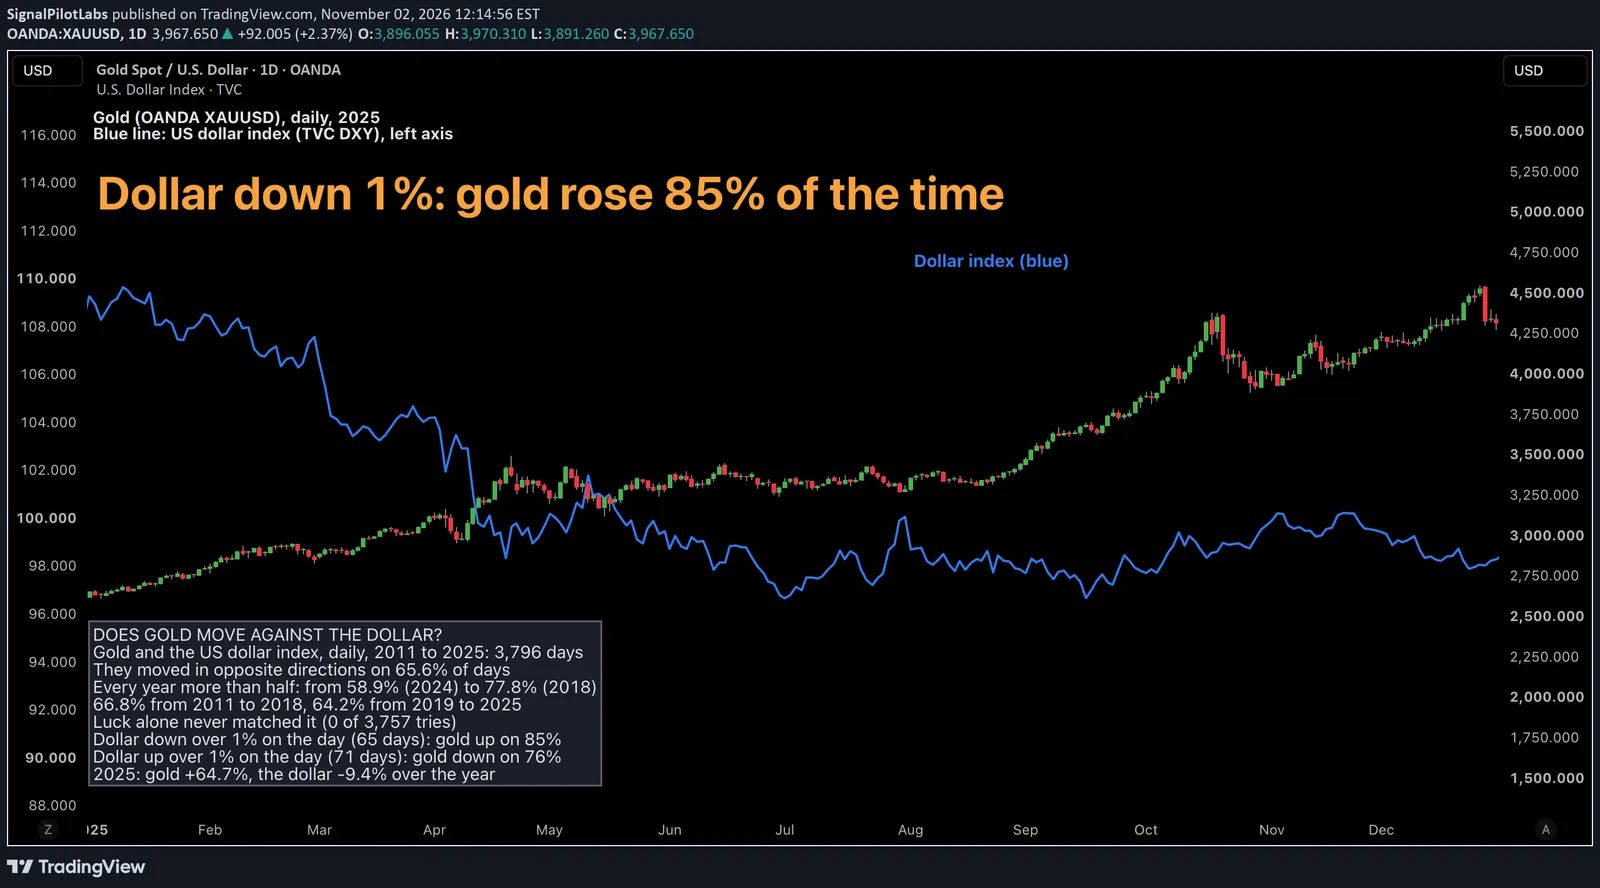
Gold is priced in dollars, so a weaker dollar should mean dearer gold. We measured how often gold and the US dollar index moved in opposite directions from one close to the next, from 2011 to 2025.
What we measured
TradingView daily closes for gold (OANDA XAUUSD) and the US dollar index (TVC DXY), on the days both traded: 3,796 days.
What we found
They moved in opposite directions on 65.6% of days, about 2 in 3, with a correlation of -0.41. Every one of the 15 years was above half: the lowest was 2024 at 58.9%, the highest 2018 at 77.8%.
The big dollar days show it most. On the 65 days the dollar index fell more than 1%, gold rose on 55, 85%. On its 71 days up more than 1%, gold fell on 54, 76%.
| Year | Opposite directions (%) | Correlation | Days | Gold over the year (%) | Dollar index over the year (%) |
|---|---|---|---|---|---|
| 2011 | 59.4 | -0.23 | 252 | +10.1 | +1.5 |
| 2012 | 68.3 | -0.48 | 252 | +7.1 | -0.5 |
| 2013 | 64.4 | -0.41 | 252 | -28.1 | +0.3 |
| 2014 | 68.5 | -0.45 | 251 | -1.9 | +12.8 |
| 2015 | 61.9 | -0.36 | 252 | -10.3 | +9.3 |
| 2016 | 65.7 | -0.39 | 252 | +8.5 | +3.6 |
| 2017 | 68.3 | -0.56 | 251 | +13.2 | -9.9 |
| 2018 | 77.8 | -0.64 | 252 | -1.6 | +4.4 |
| 2019 | 64.7 | -0.51 | 252 | +18.3 | +0.2 |
| 2020 | 60.5 | -0.36 | 253 | +25.1 | -6.7 |
| 2021 | 66.7 | -0.51 | 252 | -3.7 | +6.3 |
| 2022 | 66.4 | -0.50 | 251 | -0.3 | +8.3 |
| 2023 | 67.8 | -0.54 | 257 | +13.1 | -2.1 |
| 2024 | 58.9 | -0.39 | 259 | +27.2 | +7.1 |
| 2025 | 64.7 | -0.41 | 258 | +64.7 | -9.4 |
Is it luck?
The two halves agree: 66.8% from 2011 to 2018, 64.2% from 2019 to 2025. Shifting gold’s days against the dollar’s, 3,757 ways, never gave a share as high; the highest was 53.3%.
Opposite days, not always opposite years
Over whole years they went opposite ways in 11 of the 15. In 2011, 2016, 2019 and 2024 both rose; in 2024 gold gained 27.2% and the dollar index 7.1%, while they moved opposite on 58.9% of days.
What to do with it
On a big dollar day, expect gold to move the other way more often than not. Over a year, look at both. Our post on gold, silver and copper measured how far each moves in a normal week: gold 5%, silver 11%, copper 5%.
On the chart
Gold, daily, 2025, with the dollar index drawn over it in blue on its own scale: read it on the left axis. Over 2025 gold rose 64.7% and the dollar index fell 9.4%.
How to check two markets yourself
- Take both markets’ daily closes on the days both traded.
- Count the days they moved in opposite directions, year by year.
- Then look at the biggest days of one market and see what the other did.
What this does not tell you
Which way either will go, or which one moves first. Past data.
Observations, not recommendations.
We’re Signal Pilot Labs. We build the Elite Seven, seven indicators for TradingView, and we post what we measure, including the parts that didn’t work.
See what we build at signalpilot.io.
Published as a TradingView Idea on XAUUSD. View the chart on TradingView
Past measurement described after the fact. Nothing here is a recommendation or an indication of future results.