Published as a TradingView Idea on GOLD. View the chart on TradingView
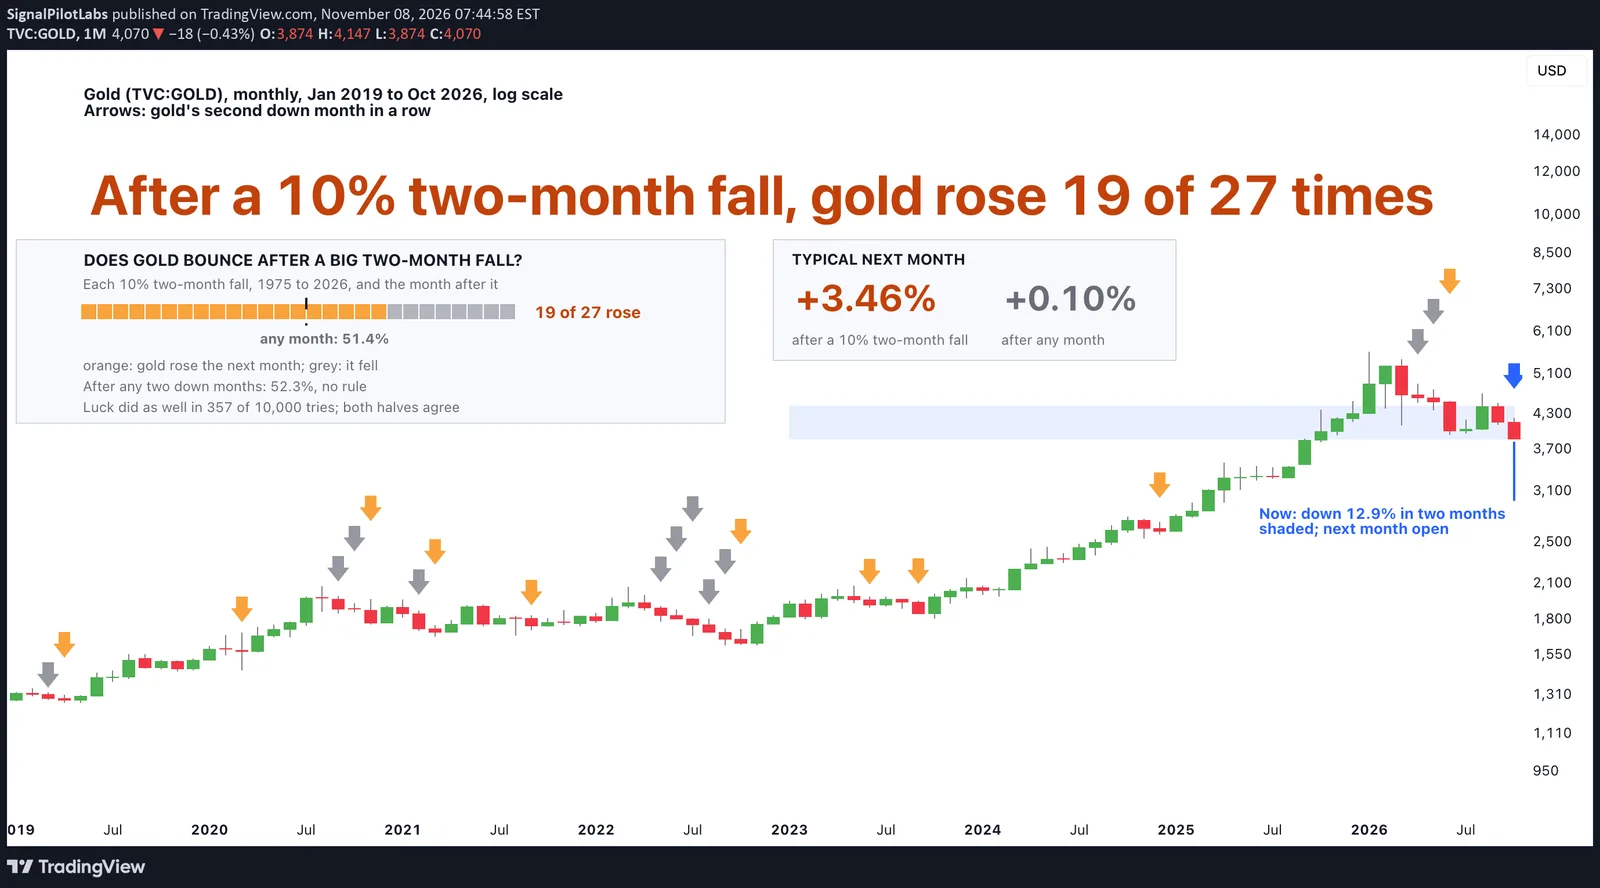
Gold closed lower in September and October 2026, from 4,447.90 to 3,875.19, a 12.9% fall in two months. Is the run over, or does gold bounce? We checked every month since 1975.
What we measured
TradingView’s monthly closes of spot gold (TVC:GOLD) from January 1975, when Americans could own gold again, to October 2026: 622 months. We took two groups: every month that closed 10% or more below the close two months before, and every second down month in a row. For each we asked whether the next month closed higher, against any month. We wrote the two tests and the bar down before counting a single month.
What we found
After its 27 earlier falls of 10% or more over two months, gold rose the next month 19 times, 70.4%. After any month it rose 51.4% of the time. The typical month after such a fall was +3.46%, against +0.10% after any month.
Two down months in a row on their own told us nothing: the next month rose 52.3% of the time, about the same as any month.
| After | Months | The next month rose (%) | After any month (%) | Luck did as well (of 10,000) |
|---|---|---|---|---|
| A fall of 10% or more over two months | 27 | 70.4 | 51.4 | 357 |
| Any two down months in a row | 149 | 52.3 | 51.4 | 4,283 |
Could it be luck?
We drew 27 months at random, 10,000 times: 357 draws held 19 rises or more. It held in both halves too: 72.2% against 46.8% from 1975 to 2000, and 66.7% against 56.0% from 2001 to 2026. That meets the bar we set first. One caveat: several of the 27 sit next to each other inside the same big falls (1980, 1981), so they are fewer separate episodes than 27.
The 27 falls
| Month | Over two months (%) | The next month (%) |
|---|---|---|
| September 1975 | -17.99 | +0.42 |
| October 1975 | -12.29 | -3.85 |
| August 1976 | -16.71 | +12.50 |
| November 1978 | -11.09 | +16.60 |
| March 1980 | -26.41 | +0.02 |
| April 1980 | -20.51 | +8.69 |
| January 1981 | -19.68 | -3.73 |
| February 1981 | -18.32 | +6.38 |
| June 1981 | -12.32 | -4.72 |
| July 1981 | -15.83 | +5.33 |
| February 1982 | -10.10 | -9.15 |
| March 1982 | -14.85 | +4.64 |
| February 1983 | -10.98 | +3.85 |
| March 1983 | -18.47 | +3.46 |
| July 1984 | -12.69 | +3.17 |
| February 1988 | -12.57 | +6.92 |
| March 1990 | -10.23 | -0.49 |
| September 1993 | -12.75 | +3.83 |
| April 2008 | -10.30 | +1.42 |
| August 2008 | -10.20 | +4.84 |
| October 2008 | -12.86 | +13.12 |
| May 2013 | -12.99 | -11.03 |
| June 2013 | -16.27 | +7.09 |
| November 2016 | -10.84 | -1.90 |
| April 2026 | -12.54 | -1.70 |
| June 2026 | -13.20 | +0.85 |
| July 2026 | -10.95 | +10.06 |
The deepest drops
Gold’s deepest two-month fall, to March 1980, was -26.41%, and the next month was flat (+0.02%). The longest run of down months, April to October 2022, lost 15.68% and the next month rose 8.28%. October 2026 is the open case: -12.88% over two months, its next month not closed.
On the chart
Gold monthly on a log scale (equal steps are equal percentage moves), 2019 to 2026. An arrow marks each second down month in a row: orange when the next month rose, grey when it fell, and the last month in blue, still open. A light blue band shades the latest fall, from August’s close down to the last one.
What to do with it
A 10% two-month fall in gold has more often been followed by a higher month than not, about 7 times in 10 since 1975. It says nothing about the month after that, or how far. Two small down months alone are not a reason either way. Our post on how far gold, silver and copper move in a normal week gives the size of an ordinary move.
How to check it yourself
- Take gold’s monthly closes and mark each month that closed 10% or more below the close two months before.
- For each, see whether the next month closed higher, and do the same for every month.
- Compare the shares, then in each half of the record, and see how often random months do as well.
What this does not tell you
Why gold fell, where November closes, or other metals. 27 events, some from the same years. Monthly closes, past data.
Observations, not recommendations.
We’re Signal Pilot Labs. We build the Elite Seven, seven indicators for TradingView, and we post what we measure, including the parts that didn’t work.
See what we build at signalpilot.io.
Published as a TradingView Idea on GOLD. View the chart on TradingView
Past measurement described after the fact. Nothing here is a recommendation or an indication of future results.