Published as a TradingView Idea on APP. View the chart on TradingView
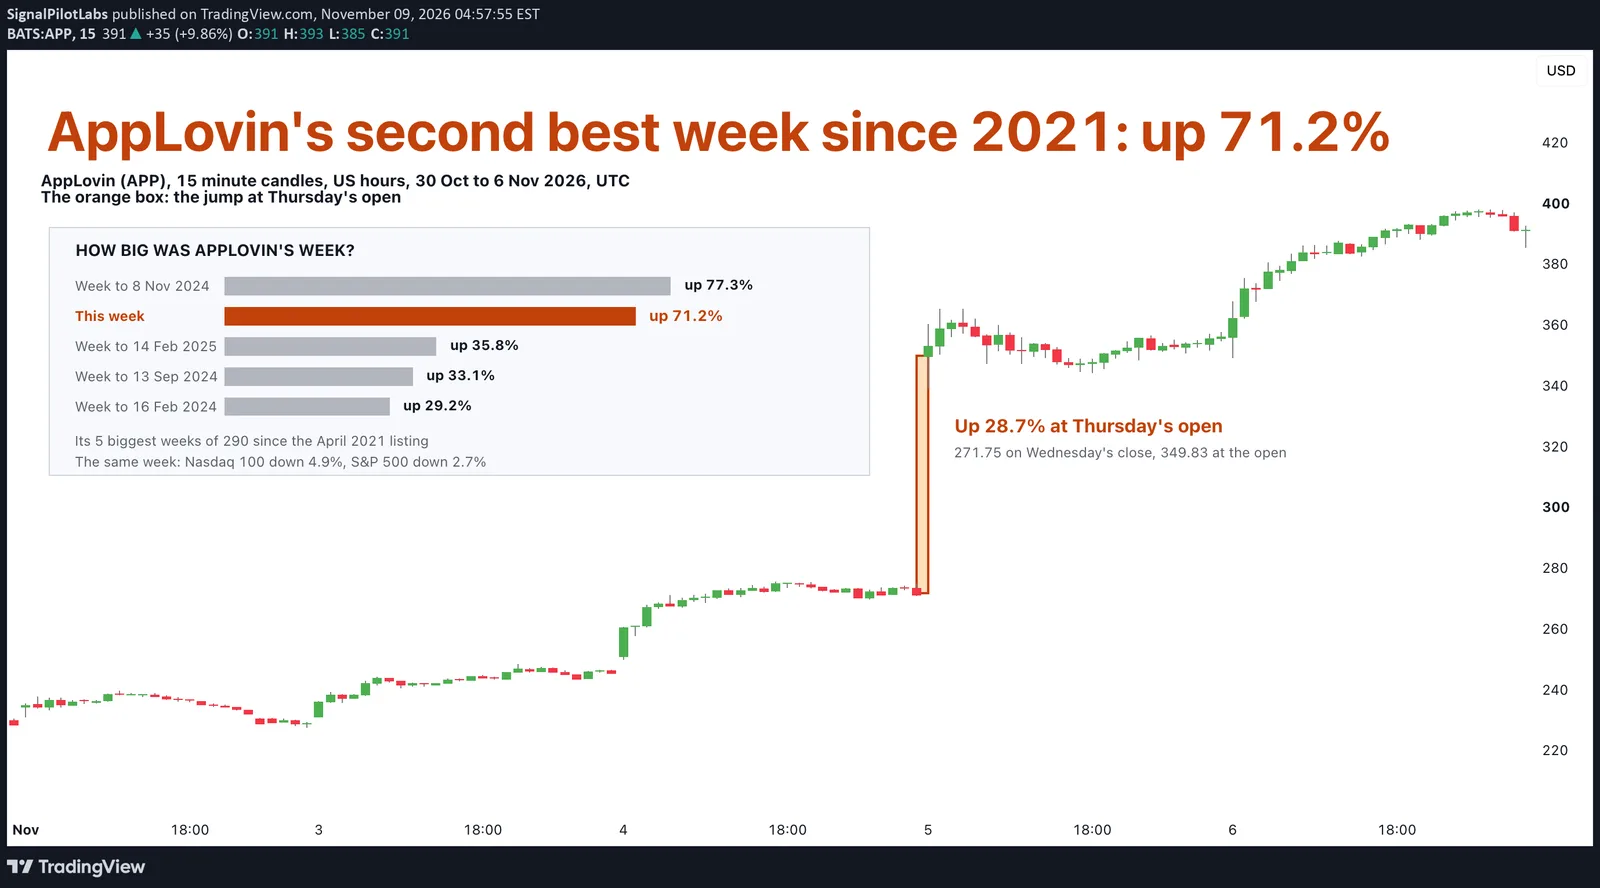
AppLovin closed at 228.50 on Friday 30 October 2026 and at 391.22 on Friday 6 November, up 71.2% in five trading days. Over the same days the Nasdaq 100 fell 4.9% and the S&P 500 fell 2.7%. We claim no cause: the candles show when the price moved, not why.
What we measured
TradingView’s daily and intraday candles of AppLovin (APP), the Nasdaq 100 and the S&P 500, and Bybit’s public candles for its stock contracts. We wrote the questions down before pulling any AppLovin candle or reading any news of the week.
How big was the week?
We ranked every week since AppLovin listed in April 2021: 290 of them, Friday close to Friday close. This was the second biggest. The biggest was the week to 8 November 2024, up 77.3%. Third came the week to 14 February 2025, up 35.8%, so the top two stand far above the rest.
The five days
| Day | Previous close | Open | Close | Gap at the open | Open to close | The day |
|---|---|---|---|---|---|---|
| Mon 2 Nov | 228.50 | 234.53 | 228.85 | +2.6% | -2.4% | +0.2% |
| Tue 3 Nov | 228.85 | 231.25 | 245.51 | +1.0% | +6.2% | +7.3% |
| Wed 4 Nov | 245.51 | 250.96 | 271.75 | +2.2% | +8.3% | +10.7% |
| Thu 5 Nov | 271.75 | 349.83 | 356.10 | +28.7% | +1.8% | +31.0% |
| Fri 6 Nov | 356.10 | 355.95 | 391.22 | 0.0% | +9.9% | +9.9% |
We split each day in two: the gap from the last close to the open, and the move from the open to the close. Thursday 5 November did most of the work: the stock opened 28.7% above Wednesday’s close, before the session began, and the session added only 1.8%. Tuesday rose 6.2% from its open, Wednesday 8.3% and Friday 9.9%. Over the week the five gaps together added 36.4% and the five sessions together 25.5%.
AppLovin released its third-quarter results on Wednesday 4 November, after the US close. That is when the report came out; the candles cannot say it is why the price moved.
It moved against the market
On Thursday, AppLovin’s 31.0% day, the Nasdaq 100 fell 6.4% and the S&P 500 fell 4.4%. Of the 40 stock contracts most traded on Bybit the week before, 22 fell more than 10% over the week and only 6 rose; the best of them, Moderna, rose 14.8%. AppLovin’s own contract rose 70.4%, which would have put it first.
Bybit’s contract saw Thursday’s jump first
Bybit lists an AppLovin contract that trades around the clock. At 14:15 UTC on Thursday, 15 minutes before the US open, it stood at 347.92, already 28.0% above Wednesday’s close. The stock opened at 349.83, 0.5% above it. On each of the five mornings the open came within 0.6% of the contract.
On the chart
AppLovin, 15-minute candles in US trading hours, the week of 2 to 6 November 2026. The orange box is Thursday’s jump at the open; the panel ranks the stock’s five biggest weeks since 2021.
How to read a week like this yourself
- Rank the week against the stock’s own history, Friday close to Friday close.
- Split each day into the gap at the open and the session, and add each up over the week.
- Put the index beside it, day by day.
- Check when the company’s own report came out. A date is not a cause.
The same split on another big week is in our post on CoreWeave’s week.
What this does not tell you
One week, one stock. Whether the move holds, or why it happened. Bybit’s contract and the stock are different markets, and the 40 contracts were ranked by Bybit turnover, not by any index. Past data.
Observations, not recommendations.
We’re Signal Pilot Labs. We build the Elite Seven, seven indicators for TradingView, and we post what we measure, including the parts that didn’t work.
See what we build at signalpilot.io.
Published as a TradingView Idea on APP. View the chart on TradingView
Past measurement described after the fact. Nothing here is a recommendation or an indication of future results.