Published as a TradingView Idea on ETHUSDT. View the chart on TradingView
If you have ever ported an indicator into Python to backtest it, or trusted a script because it came with a verification, this is about the gap those two things leave open.
We rebuilt three of our own indicators so a backtest could run over them. All three rebuilds had a wrong constant in them. All three passed their validation. Not one was caught by a test.
Why rebuild an indicator at all
A Pine script runs on your chart. It does not run over six years of history in a loop, and it does not answer whether a signal actually pays. To ask that, you rebuild it in something you can run thousands of times.
That rebuild is where an indicator quietly stops being the same indicator.
The bug that cost the most, and it is one bar
One of the lengths inside Volume Oracle is derived from the timeframe:
target bars   = 36 hours × 60 / 240 minutes = 9
regime length = round(9 × 2.5) = round(22.5)
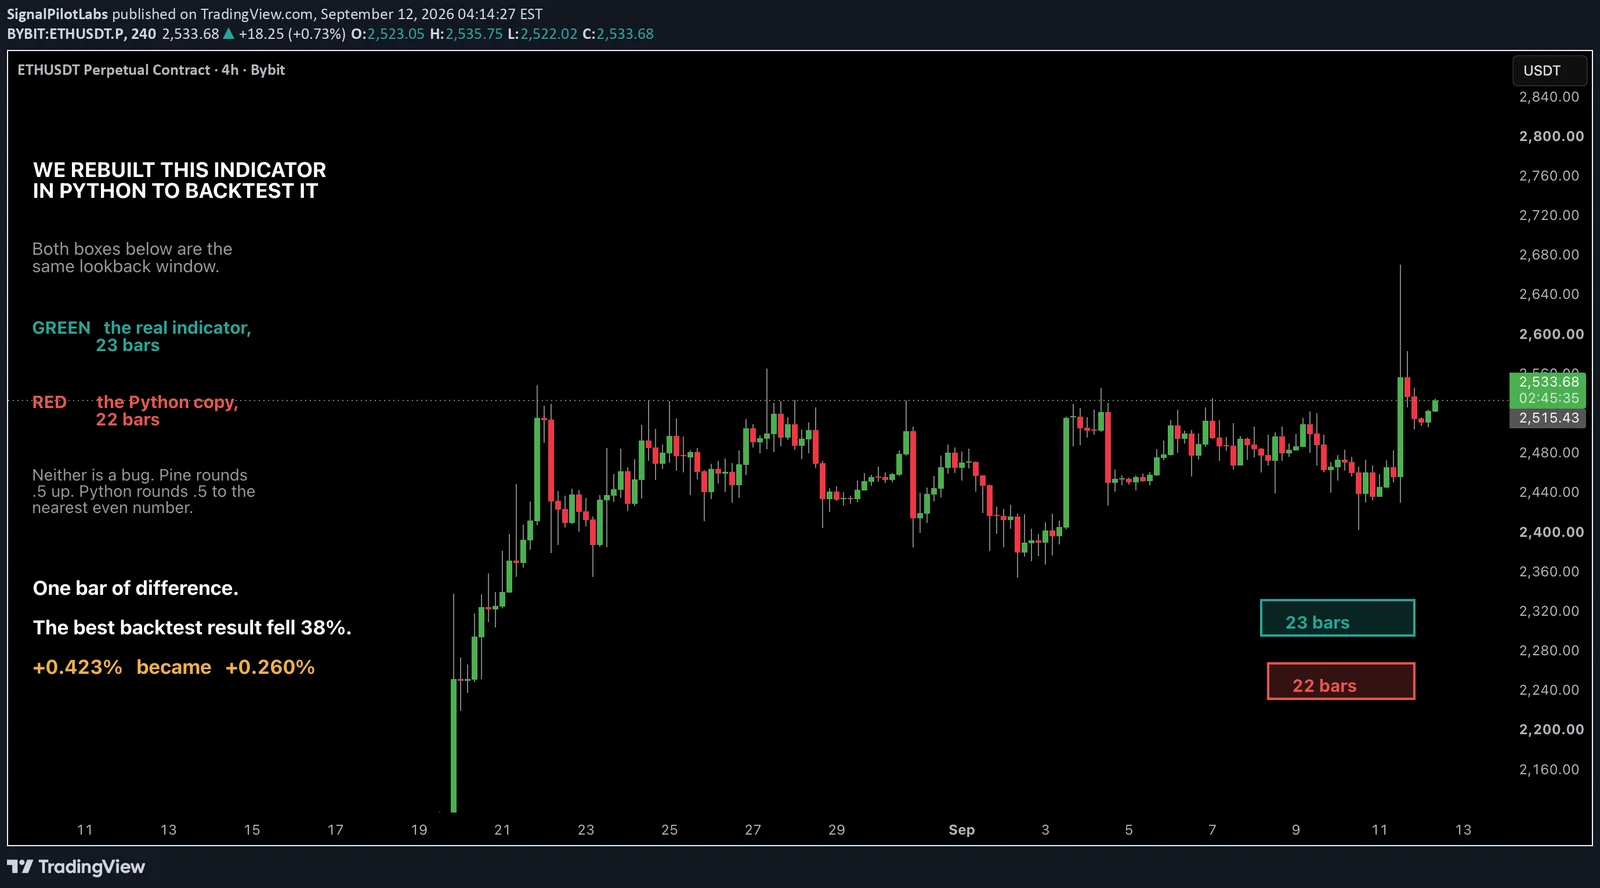
Pine’s math.round breaks ties away from zero. It gives 23. Python 3’s round() uses banker’s rounding, which breaks ties toward the even number. It gives 22.
Both are correct implementations of rounding. They are simply different conventions, and nothing warns you that you have crossed from one to the other.
Every lookback derived from that number moved with it. The result on the best supported row of a 36 signal sweep:
| version | 48h edge | win rate | n |
|---|---|---|---|
| rebuilt, length 22 | +0.423% | 51 | 1216 |
| correct, length 23 | +0.260% | 50 | 1223 |
A 38% haircut from a rounding convention.
We then recorded the lesson wrong
The note we wrote said it happened at 4H only. It was written from the one timeframe that happened to be under test, and it stayed that way for two months.
Running the same arithmetic across every timeframe:
| timeframe | regime length | flow length | result |
|---|---|---|---|
| 5m | 45 vs 45 | 23 vs 22 | diverges |
| 2H | 45 vs 45 | 23 vs 22 | diverges |
| 4H | 23 vs 22 | 12 vs 11 | diverges |
| 8H | 53 vs 52 | 27 vs 26 | diverges |
| 1D | 18 vs 18 | 9 vs 9 | ties, agrees |
| 3D, 1W | 15 vs 15 | 8 vs 8 | ties, agrees |
Four of sixteen, not one.
Two things fall out of that table that no amount of reasoning produced.
A tie is not enough. 1D, 3D and 1W all land exactly on .5 and agree. Banker’s rounding only moves a tie whose round half up answer is odd, so round(17.5) is 18 either way. Roughly half of all ties are harmless, which is precisely why spot checking one proves nothing.
The divergence can arrive one step late. At 5m and 2H the first length agrees at 45. The next line, round(45 × 0.5), is another 22.5, and that one splits. If you check the first constant and move on, you clear both timeframes wrongly.
The other two, briefly
Harmonic normalises an oscillator by clipping it to a rolling band. In the source, each bar is clipped by its own band. The rebuild clipped an entire 200 bar window using the current bar’s band, which is a different function. Measured difference across 11,497 bars: mean 0.47 points. A real transcription error with no material effect.
We also inflated that one before measuring it. It was announced as almost certainly the 9% drift, from reading the code. The number was 0.47. A real bug and a material bug are different claims, and the magnitude gets measured before the impact gets named.
Plutus Flow averages volume over 50 bars to detect spikes. The rebuild used 20, because that was the number we thought we knew. Effect: under a tenth of a percentage point, no sign changes. The verdict did not move, but the number was wrong and is now right, which is the only standard that matters.
The part that is actually the lesson
Here is what each rebuild’s validation reported at the time.
| rebuild | its own check | what that meant |
|---|---|---|
| Volume Oracle | 3 of 3 before, 3 of 3 after | could not tell them apart |
| Harmonic | 6 of 8 before, 5 of 8 after | scored the buggy version higher |
| Plutus Flow | never run | — |
The middle row is the one to sit with. The validation preferred the wrong code. If we had let the check decide, it would have argued us back into the bug.
A validation that compares one output value cannot detect a wrong input constant. The output is too coarse a sieve. Many different wrong parameter sets produce the same regime label, the same crossover state, the same colour on the chart today. They differ on bars you are not currently looking at, which is exactly where a backtest lives.
What to do instead
Print every derived parameter. Every length, every threshold, every multiplier. Diff them against the source line by line, before you grade anything.
Keep the output check. It catches a different class of error and it is necessary. It is just nowhere near sufficient, and all three of these walked straight past it.
The honest scope
The Pine was correct in all three cases. What was wrong was the apparatus built to test it, which is the more uncomfortable version of the problem: the instrument drifted, and the instrument’s own self check said it had not.
The 38% figure is one row, one sweep, one timeframe, in sample, and is quoted from our own record rather than re run. The rounding result is reproducible in a single command, and correcting it is what turned up the fact that our own note about it had been wrong for two months.
Published as a TradingView Idea on ETHUSDT. View the chart on TradingView
Past measurement of our own tooling, described after the fact. Nothing here is a recommendation or an indication of future results.