The problem
Scanning by hand does not scale. Seven symbols across three timeframes is twenty-one charts, and by the time you have worked through them the first one has moved on.
So you watch three symbols instead, and the setup shows up on the fourth.
What it shows
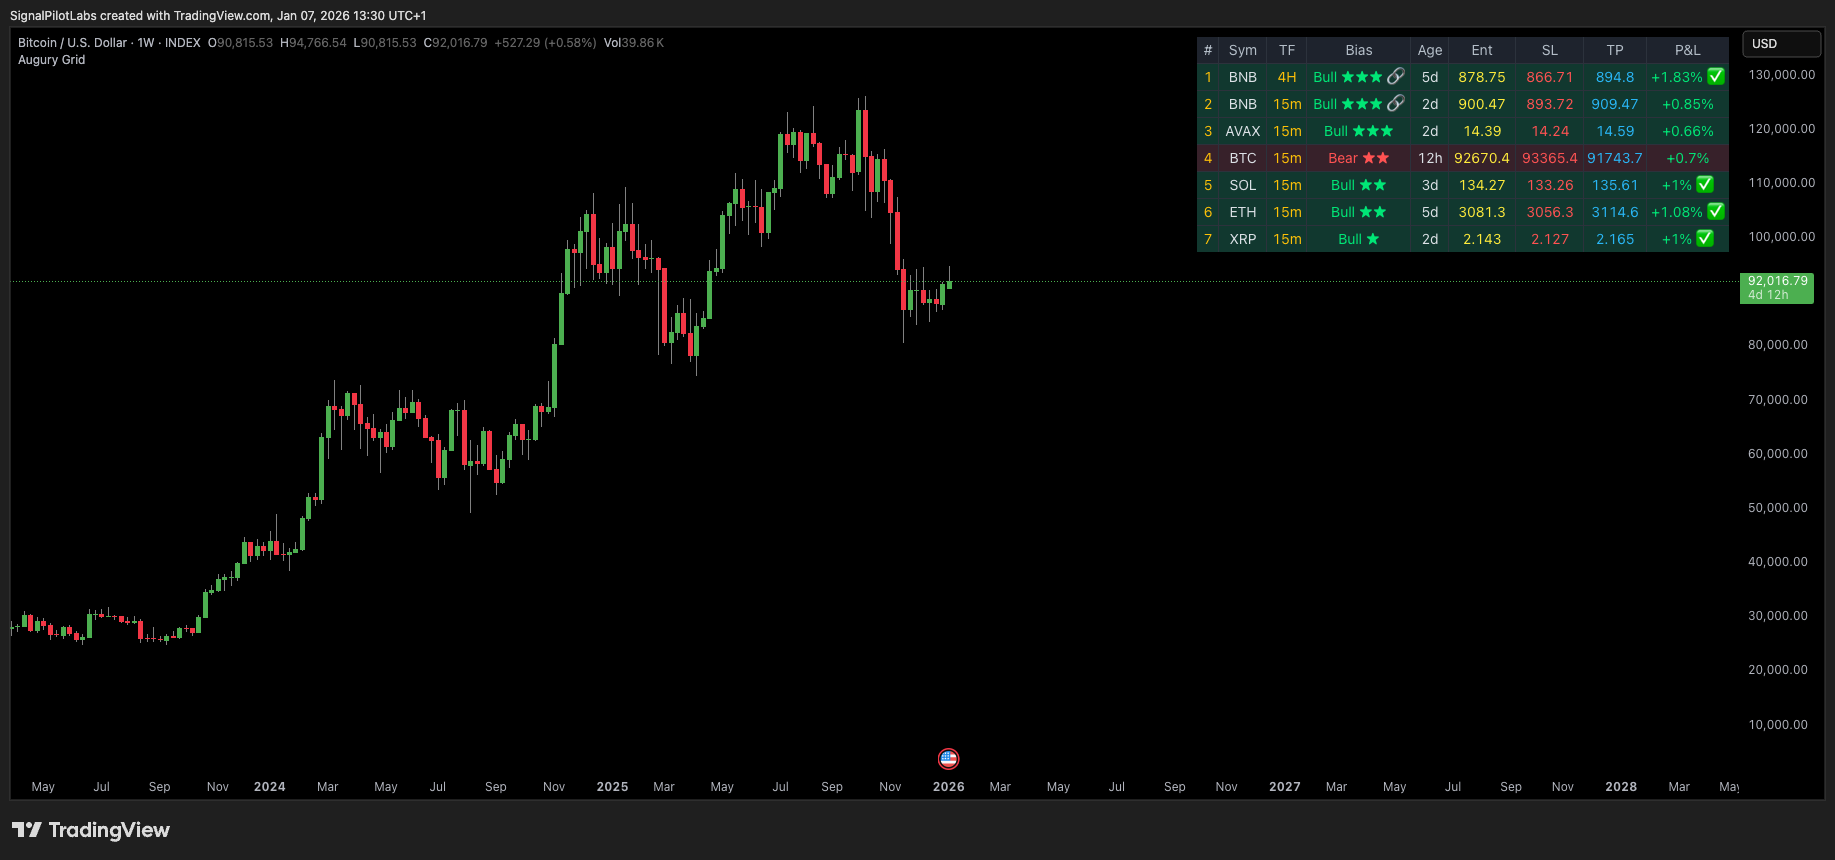
Augury Grid runs all twenty-one scans continuously and ranks what it finds, best first.
| Column | Shows |
|---|---|
| # / Sym / TF | Rank, ticker, and timeframe |
| Bias | Bull or bear, with a star quality rating |
| Age | Time elapsed since the signal |
| Entry / SL / TP | Signal price with ATR-based stop and target references |
| P&L | Current move since the signal printed |
Filtered, then scored
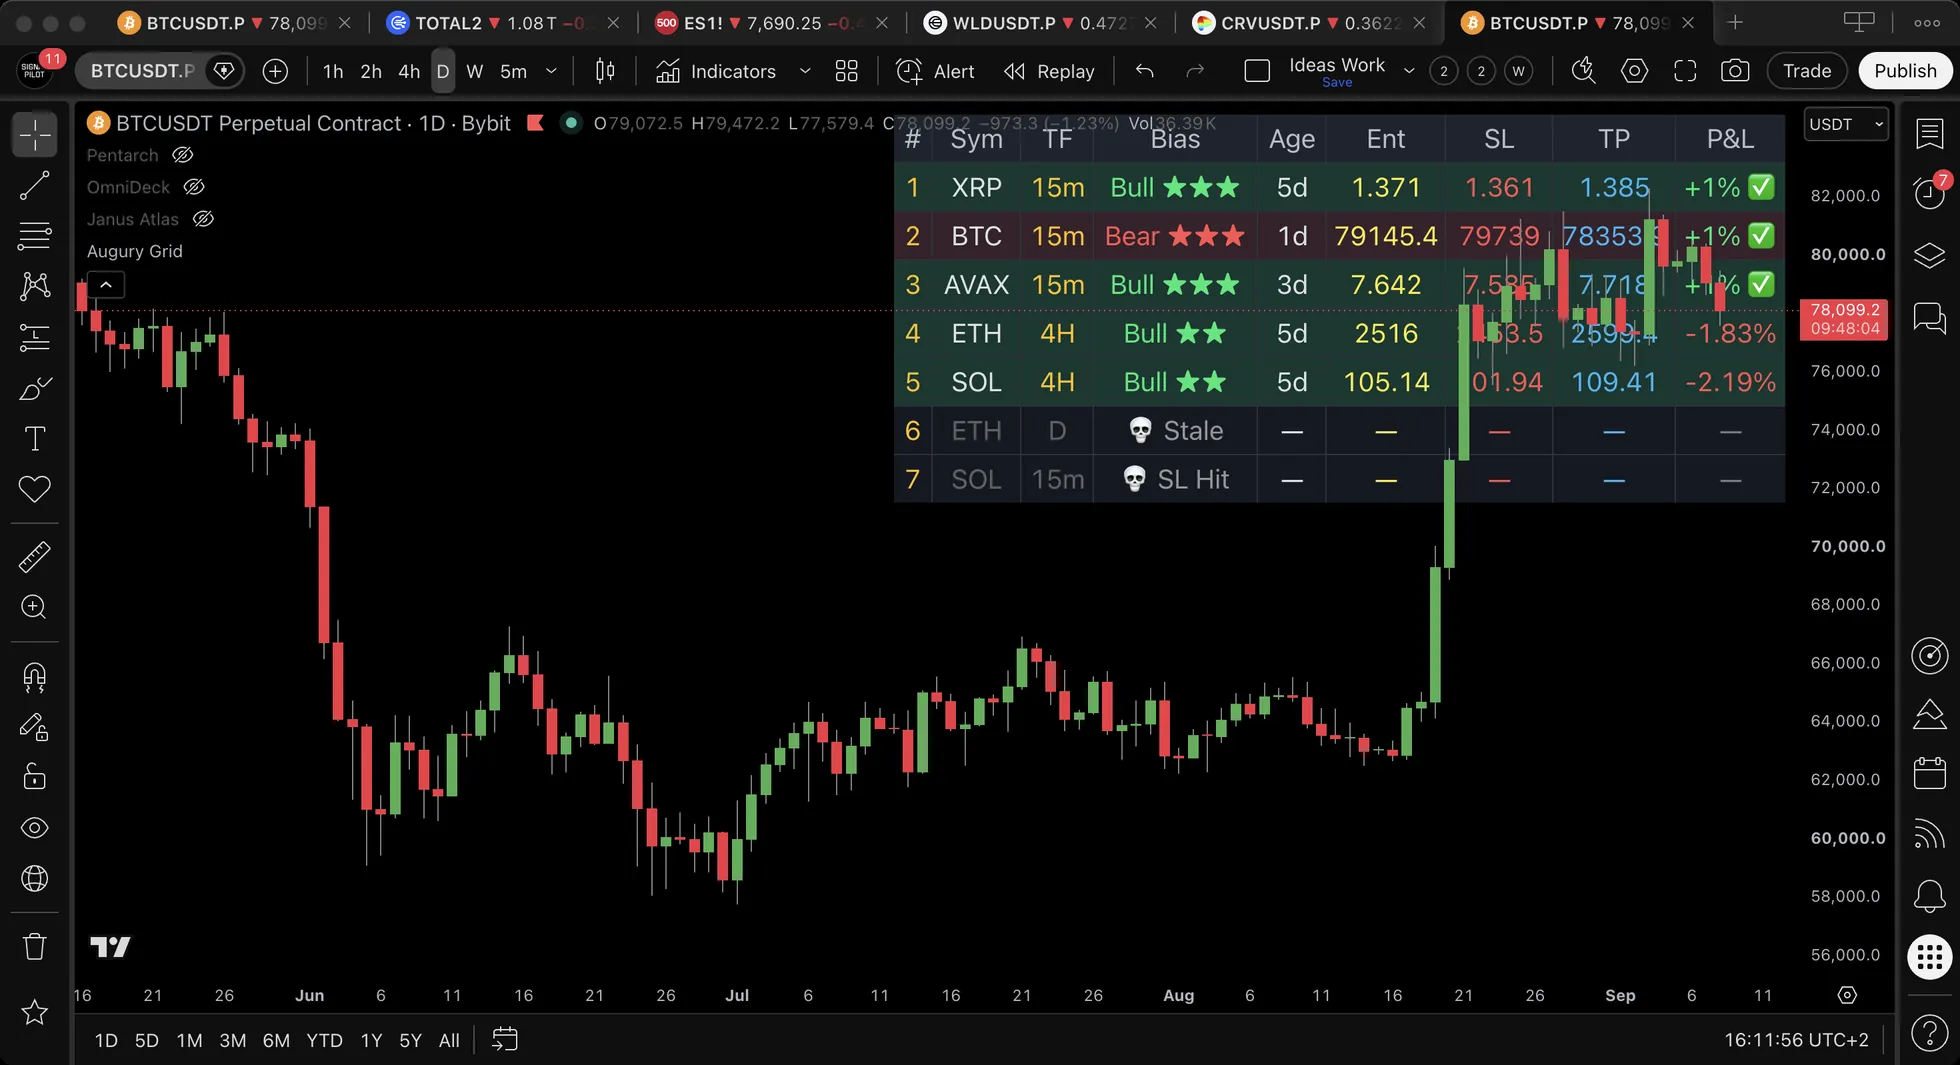
Pending and expired states are shown explicitly rather than quietly dropped, so the table reflects what actually happened rather than only what worked.
Non-repainting, and what that means here
Every marker is confirmed at bar close and stays where it printed. What you see in history is exactly what you would have seen live, and that is the only way a backtest of your own eyes means anything.
What it isn’t
A ranked table is a shortlist, not a set of instructions. Every row still needs your own read of the chart before it means anything.
Who it’s for
Traders watching more symbols than they can realistically chart, who keep finding out about setups after they have played out.
On a real chart
Every setting, every output and every panel is documented in the reference for this indicator.
Try Augury Grid
7-day free trial, no credit card. 7-day money-back guarantee. All future updates included, plus 100 free lessons in the education hub.
Part of The Elite Seven. More on cycle structure in Insights and the Chronicle.